
Your First Penetration Test
Tarek Cheikh
Founder & AWS Cloud Architect
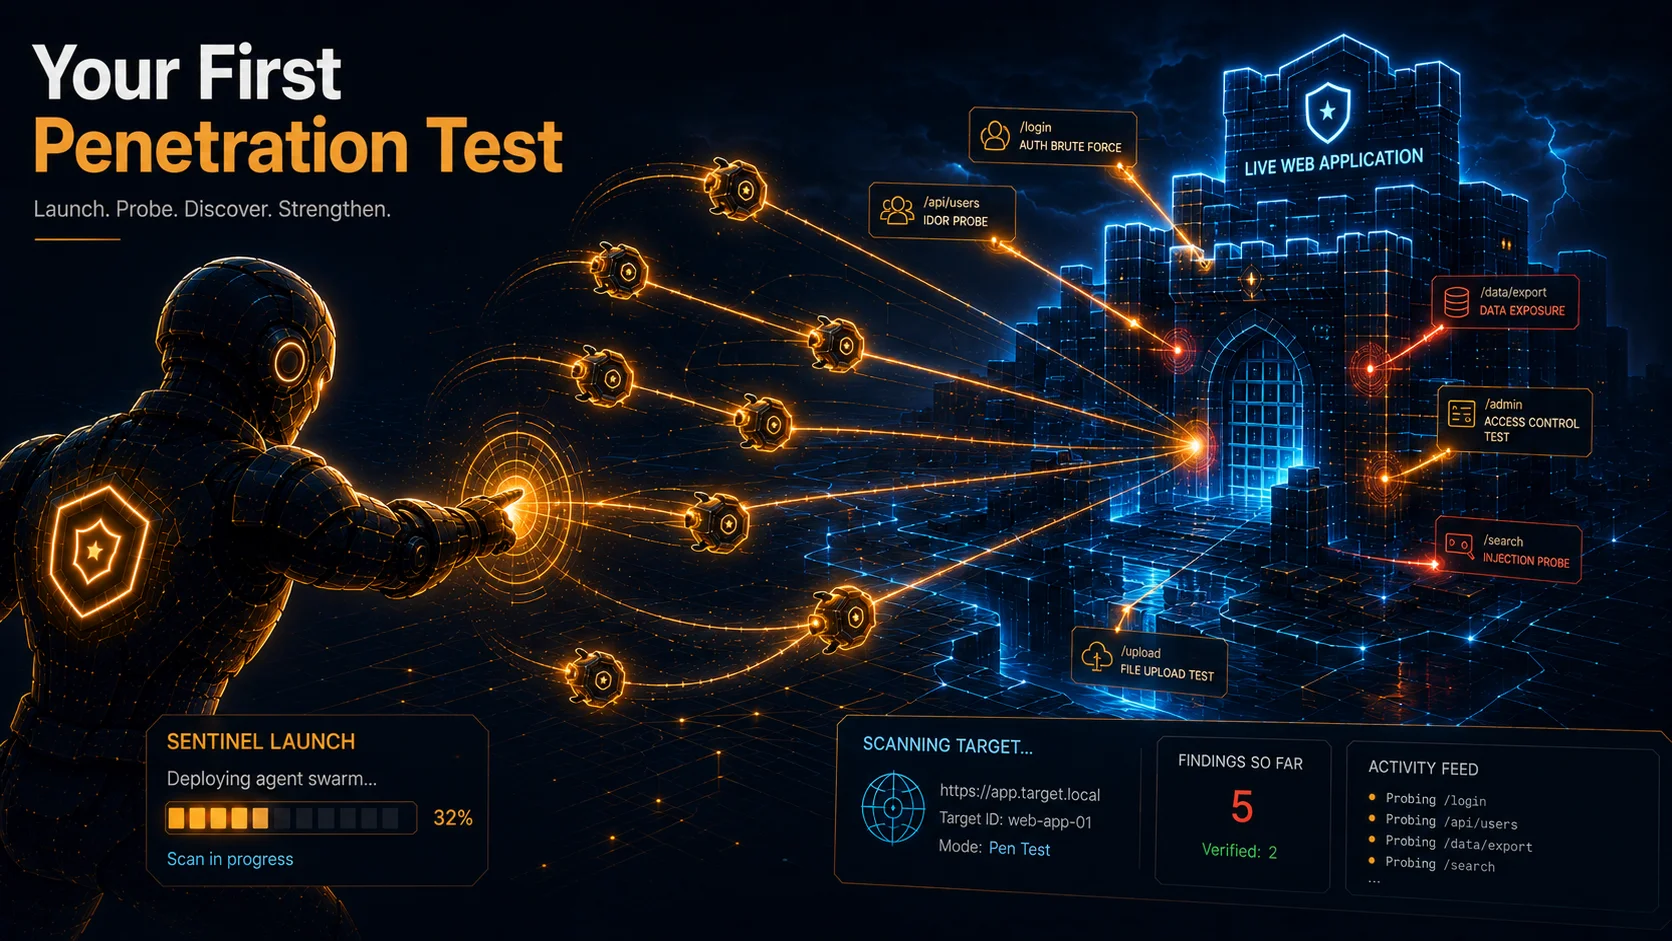
Design reviews check documents. Code reviews check source code. A penetration test attacks a live, running application. This is the GA flagship of AWS Security Agent, and it is where the multi-agent architecture earns its keep.
I pointed the agent at my deliberately vulnerable app, watched it work for two and a half hours, then downloaded every CloudWatch log stream it produced. This post walks through how I created the test, what each component does, and what the agent actually found on its first unauthenticated run. This run, run-001, was captured on March 20, 2026, during the preview window about eleven days before the March 31 GA; the workflow and phases described here are unchanged at GA.
The Target and How It Is Built
The target throughout this post is vuln-catalog, the deliberately vulnerable Flask app from the companion repository. It exposes one route per vulnerability, 39 planted vulnerabilities across 13 classes at three difficulty tiers, plus five deliberately clean endpoints, all scored against a committed answer key (vuln_map.json). The detection-rate post breaks that grid down in full; here it matters only as the thing under attack.
Getting that app to where the agent can reach it is its own small job, and the repository does it with Terraform in code/infra. The always-on lab-core module builds a VPC, a public internet-facing Application Load Balancer that terminates TLS with an ACM wildcard certificate, and a single EC2 instance (Amazon Linux, IMDSv2 required, reachable only from the load balancer, no inbound SSH). On boot the instance pulls the apps from S3 and runs docker compose up, so five of the lab apps come up behind an nginx router, each on its own subdomain: vuln., clean., evasion., subtle., and trap. under a domain you own. The agent attacks vuln-catalog at https://vuln.<your-domain>.
To stand it up: copy terraform.tfvars.example to terraform.tfvars, set domain_name and hosted_zone_id to a domain you control in Route 53 (the same domain you verified in the setup post), and run terraform apply. That is the whole code/infra folder: one Terraform root that wires three modules. lab-core is always on and is all you need for this post. Two optional modules stay off by default and switch on with a single flag when you reach them later in the series: lab-private (enable_private_subnet, the private-target setup in the advanced pentesting post) and lab-dns-confusion (enable_dns_confusion_lab, the DNS-confusion reproduction in the agent's-own-attack-surface post). lab-core has no NAT gateway, so it is inexpensive; the two optional modules each add one, which is the main running cost when you turn them on.
One safety note, because this exposes intentionally vulnerable applications on a public load balancer: keep it up only while you are testing, only run a pentest against a target you own, and run terraform destroy when you are done. The full run summary for this post is saved at the run-001 baseline summary.
Creating the Pentest
You create a penetration test inside the Security Agent web application (not the console) through a four-step wizard. Only the first step is mandatory. The rest are optional and depend on your target.
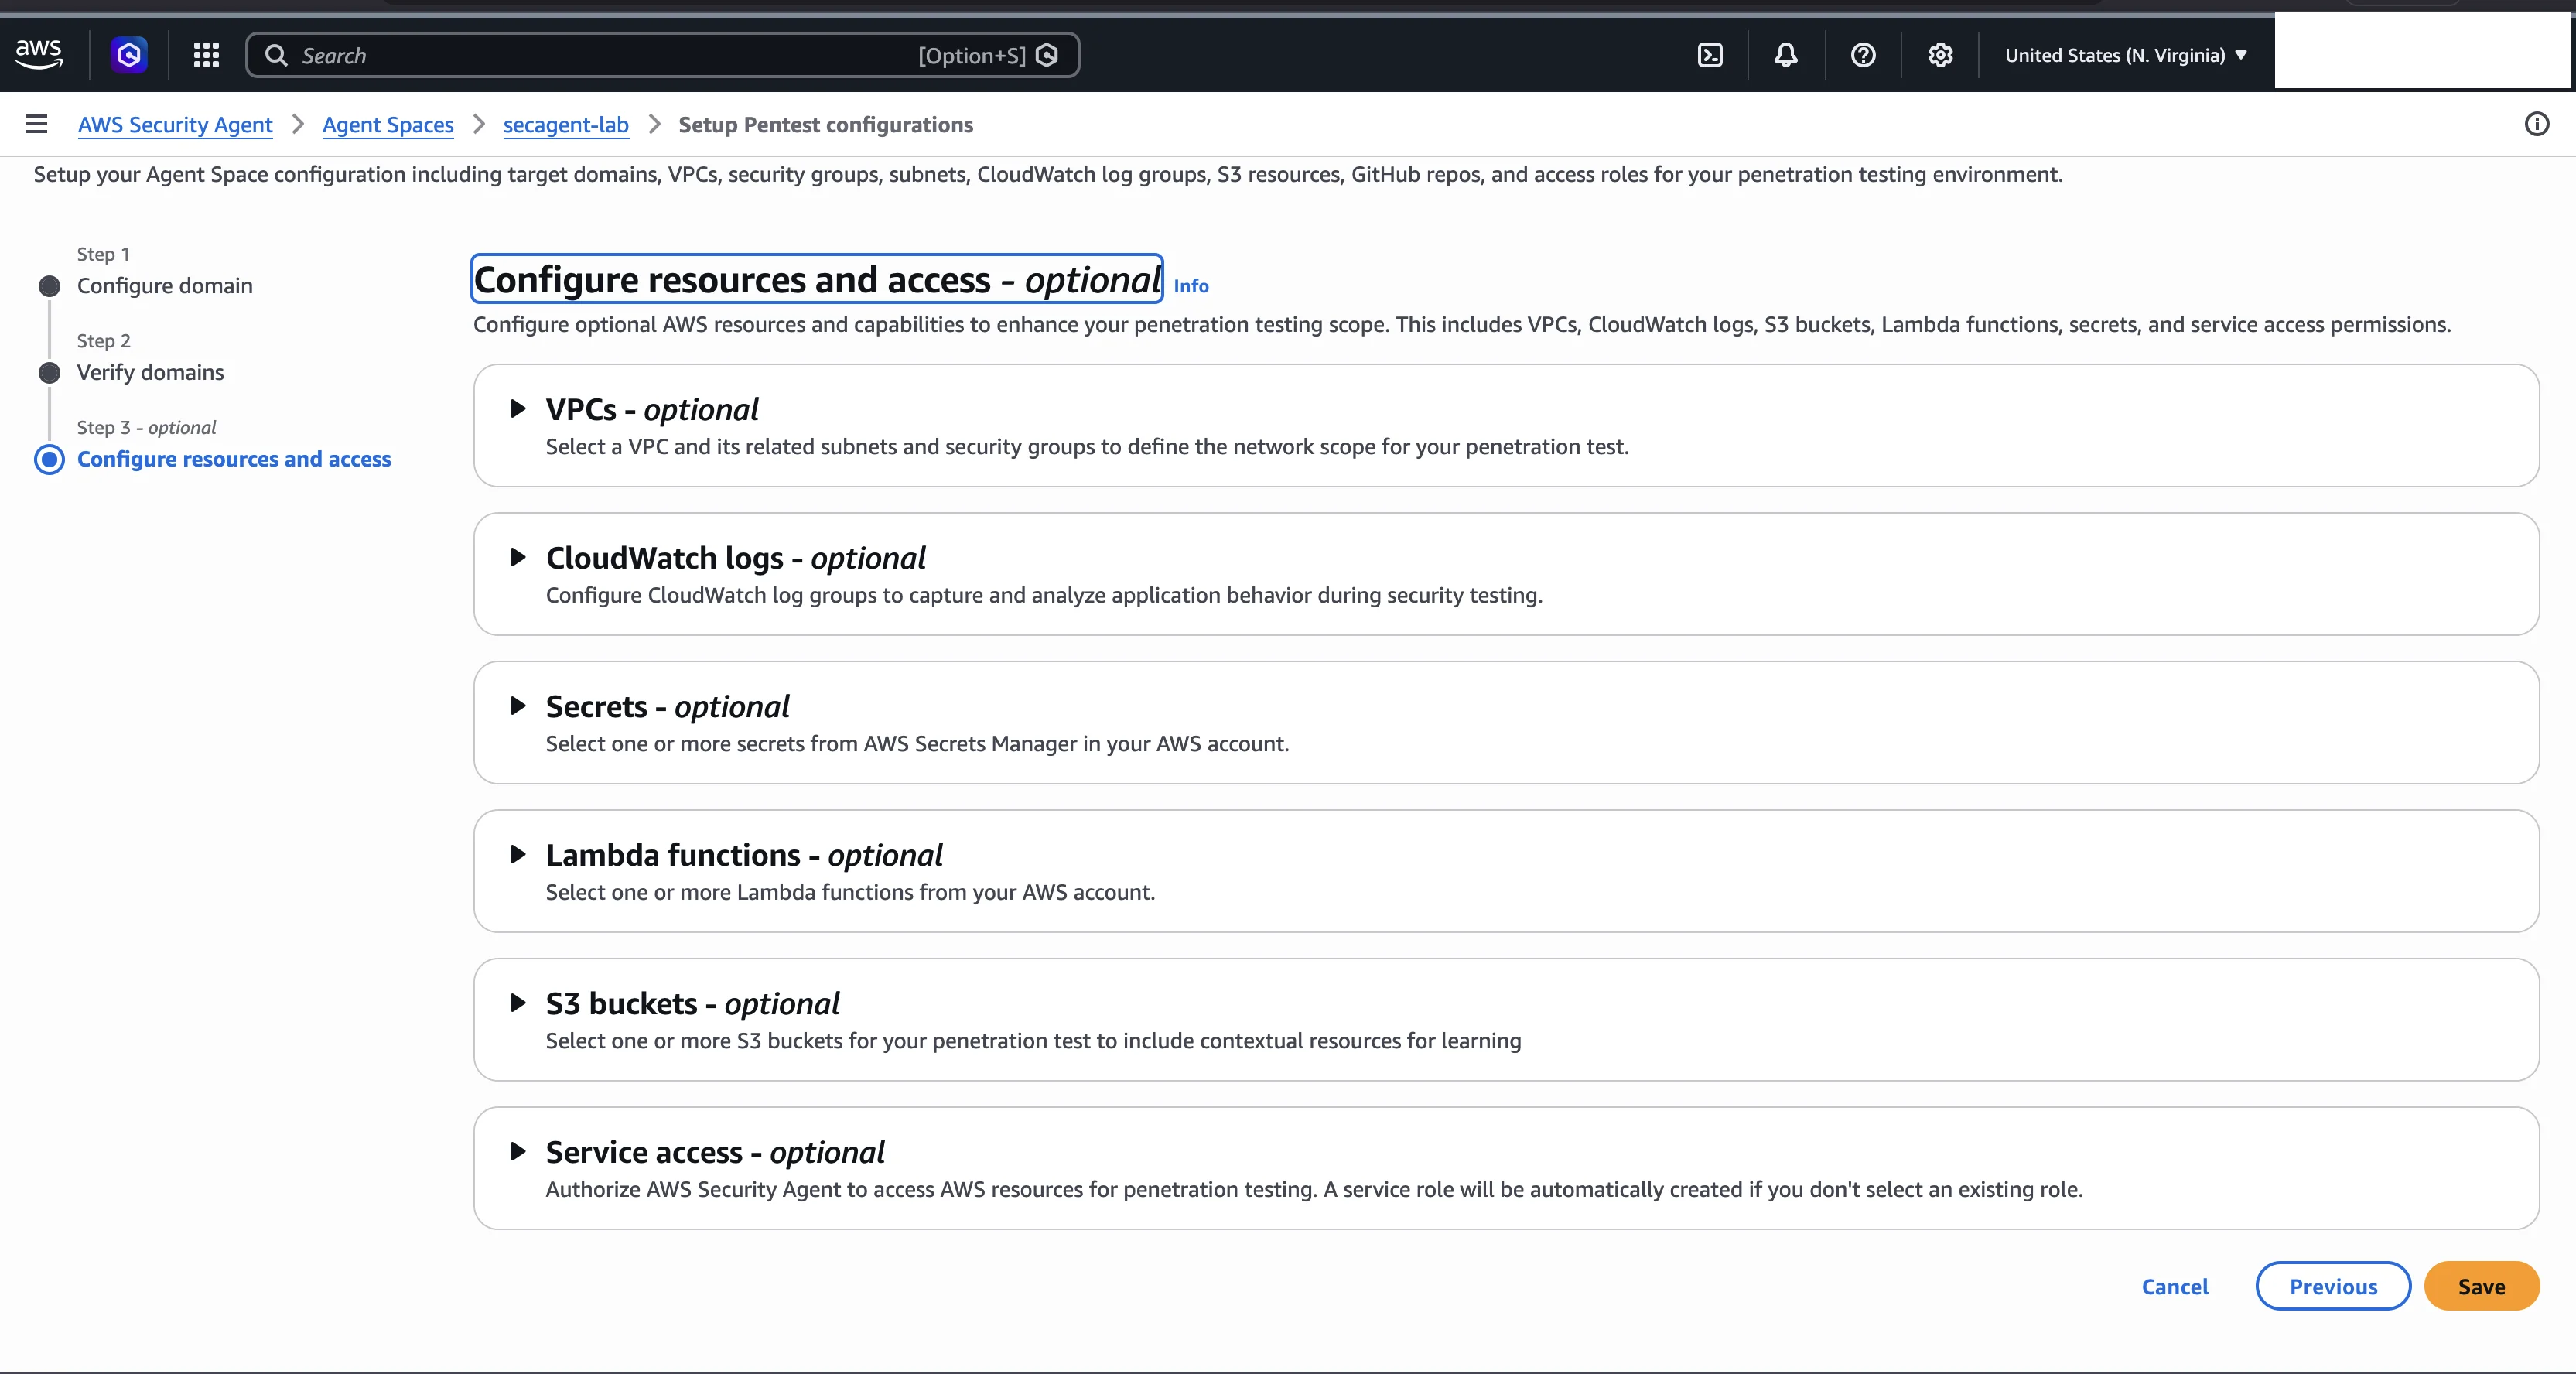
Step 1: Penetration Test Details
You provide a name and a target URL. The URL must be on a verified domain. Then you pick which risk types to test. The agent supports 13:
- Arbitrary File Upload
- Code Injection
- Command Injection
- Cross-Site Scripting (XSS)
- Insecure Direct Object Reference (IDOR)
- JSON Web Token Vulnerabilities
- Local File Inclusion
- Path Traversal
- Privilege Escalation
- Server-Side Request Forgery (SSRF)
- Server-Side Template Injection
- SQL Injection
- XML External Entity
For a first baseline I left all 13 enabled, but you can exclude any of them. You can also set out-of-scope URLs, a service IAM role, and a CloudWatch log group. If you do not select a log group, the agent auto-creates one with the /aws/securityagent prefix. One observed detail not called out in the docs: in my run the agent's requests carried the User-Agent securityagent.
This step also contains the single most important field for multi-domain applications: Accessible URLs. I cover it in its own section below because getting it wrong causes a silent failure with no error in the UI.
Step 2 (optional): VPC Configuration
This is for apps that live in private subnets. My app sits behind a public load balancer, so I skipped it. The advanced post in this series covers private targets and shared-VPC cross-account testing.
Step 3 (optional): Authentication Resources
You provide credentials so the agent can log in and test authenticated surface. There are four ways to supply them: type a static username and password directly, point at an IAM role for the agent to assume, point at an AWS Secrets Manager secret, or point at a Lambda function that returns credentials dynamically. An API key is not a separate method, it is just a value you can store inside the Secrets Manager secret or the Lambda response, alongside a username and password or on its own. TOTP-based 2FA is supported (AWS is explicit that SMS, email, push, hardware keys, and OAuth are not). Credentials are stored in your own account's Secrets Manager. I skipped this for my first run on purpose. The next post in the series shows what happens when you provide them (5 findings became 13).
Step 4 (optional): Additional Learning Resources
You can upload files, connect GitHub repositories, or add S3 links to give the agent more context about your application. This is where you would hand over a sitemap, API documentation, or your source repository. I deliberately gave the agent nothing here, because I wanted to see what it could discover on its own.
Two buttons sit at the bottom. Create penetration saves the configuration without running it. Create and execute saves and starts immediately. I clicked Create penetration to save the configuration, then started the run manually.
The Accessible URLs Requirement
The agent's container networking is locked down to allow connections only to the target URL domain. Any other domain, even a subdomain of the same parent, is blocked. The Accessible URLs field exists to whitelist domains your application talks to but should not attack. The field description reads: "Add accessible domains that your application interacts with but should not be attacked."
That description is accurate but it does not explain why the field matters or what happens if you skip it. I learned the consequence the hard way on a separate, real application. The frontend was served through CloudFront at app.dev.example-saas.com, and it called a backend API on a different subdomain, api.dev.example-saas.com.
The Authentication agent opened the login page, typed the credentials, and clicked submit. The frontend JavaScript then tried to reach the API to authenticate, and the browser returned "Failed to fetch" because the container could not resolve the API domain. The agent retried more than ten times with different approaches (direct Python requests, JavaScript evaluation, page refresh) and every attempt failed. The pentest completed with zero findings and zero errors. Nothing in the UI warned me.
The only way to diagnose it was to read the CloudWatch logs for the Authentication agent, which showed:
POST to /auth/login failed: Failed to resolve 'api.dev.example-saas.com'The fix was to add https://api.dev.example-saas.com as an Accessible URL. After that, the pentest ran normally. Here is the rule of thumb I now apply:
| Architecture | Accessible URL needed? |
|---|---|
Frontend and API on the same domain (app.example.com/api/) | No |
Frontend and API on different subdomains (app.example.com + api.example.com) | Yes, add api.example.com |
| Frontend calls an external auth provider (hosted login UI) | Yes, add the provider domain |
Frontend calls a CDN for assets (cdn.example.com) | Maybe, only if the agent needs those assets to render the page |
| Single-page app with all API calls to the target domain | No |
If your app makes requests to any domain other than the target URL (API backends, auth providers, CDN domains), add them here. Otherwise the pentest can silently fail at the login stage.
Watching It Run
The monitor view shows a horizontal pipeline with four phases: Preflight, Static analysis, Pentest, and Finalizing. Below the pipeline, actions appear one by one as the agent progresses. Each action belongs to a group and carries a status, a duration, and a description. You can stop the test at any time, and the overview, the Logs tab, and your CloudWatch log group all give you progressively more detail.
Here is what happened, in order.
Setup Infrastructure
The agent provisions its own environment before testing begins. From the logs, it runs a seven-step sequence: set up infrastructure, provision compute, configure networking, start a container, connect to it, lock down the container's network to reach only allowed targets, then confirm completion. This took about seven minutes. The container lockdown step is the one that makes the Accessible URLs field necessary: the agent builds a permissive environment first, then restricts outbound traffic to the target domain only.
Network Scanners
Three scanners run in parallel to map the target.
The TLS Scanner checks the TLS/SSL configuration of your endpoints. It examines certificate validity, supported protocol versions, and cipher suites. On my app it finished in about a minute with zero findings, because the load balancer terminates TLS with a managed certificate and there was nothing to flag.
The Scanner does a network-level scan. It finds open ports, running services, and basic endpoint information. It found one endpoint, ran deduplication, and finished in five seconds.
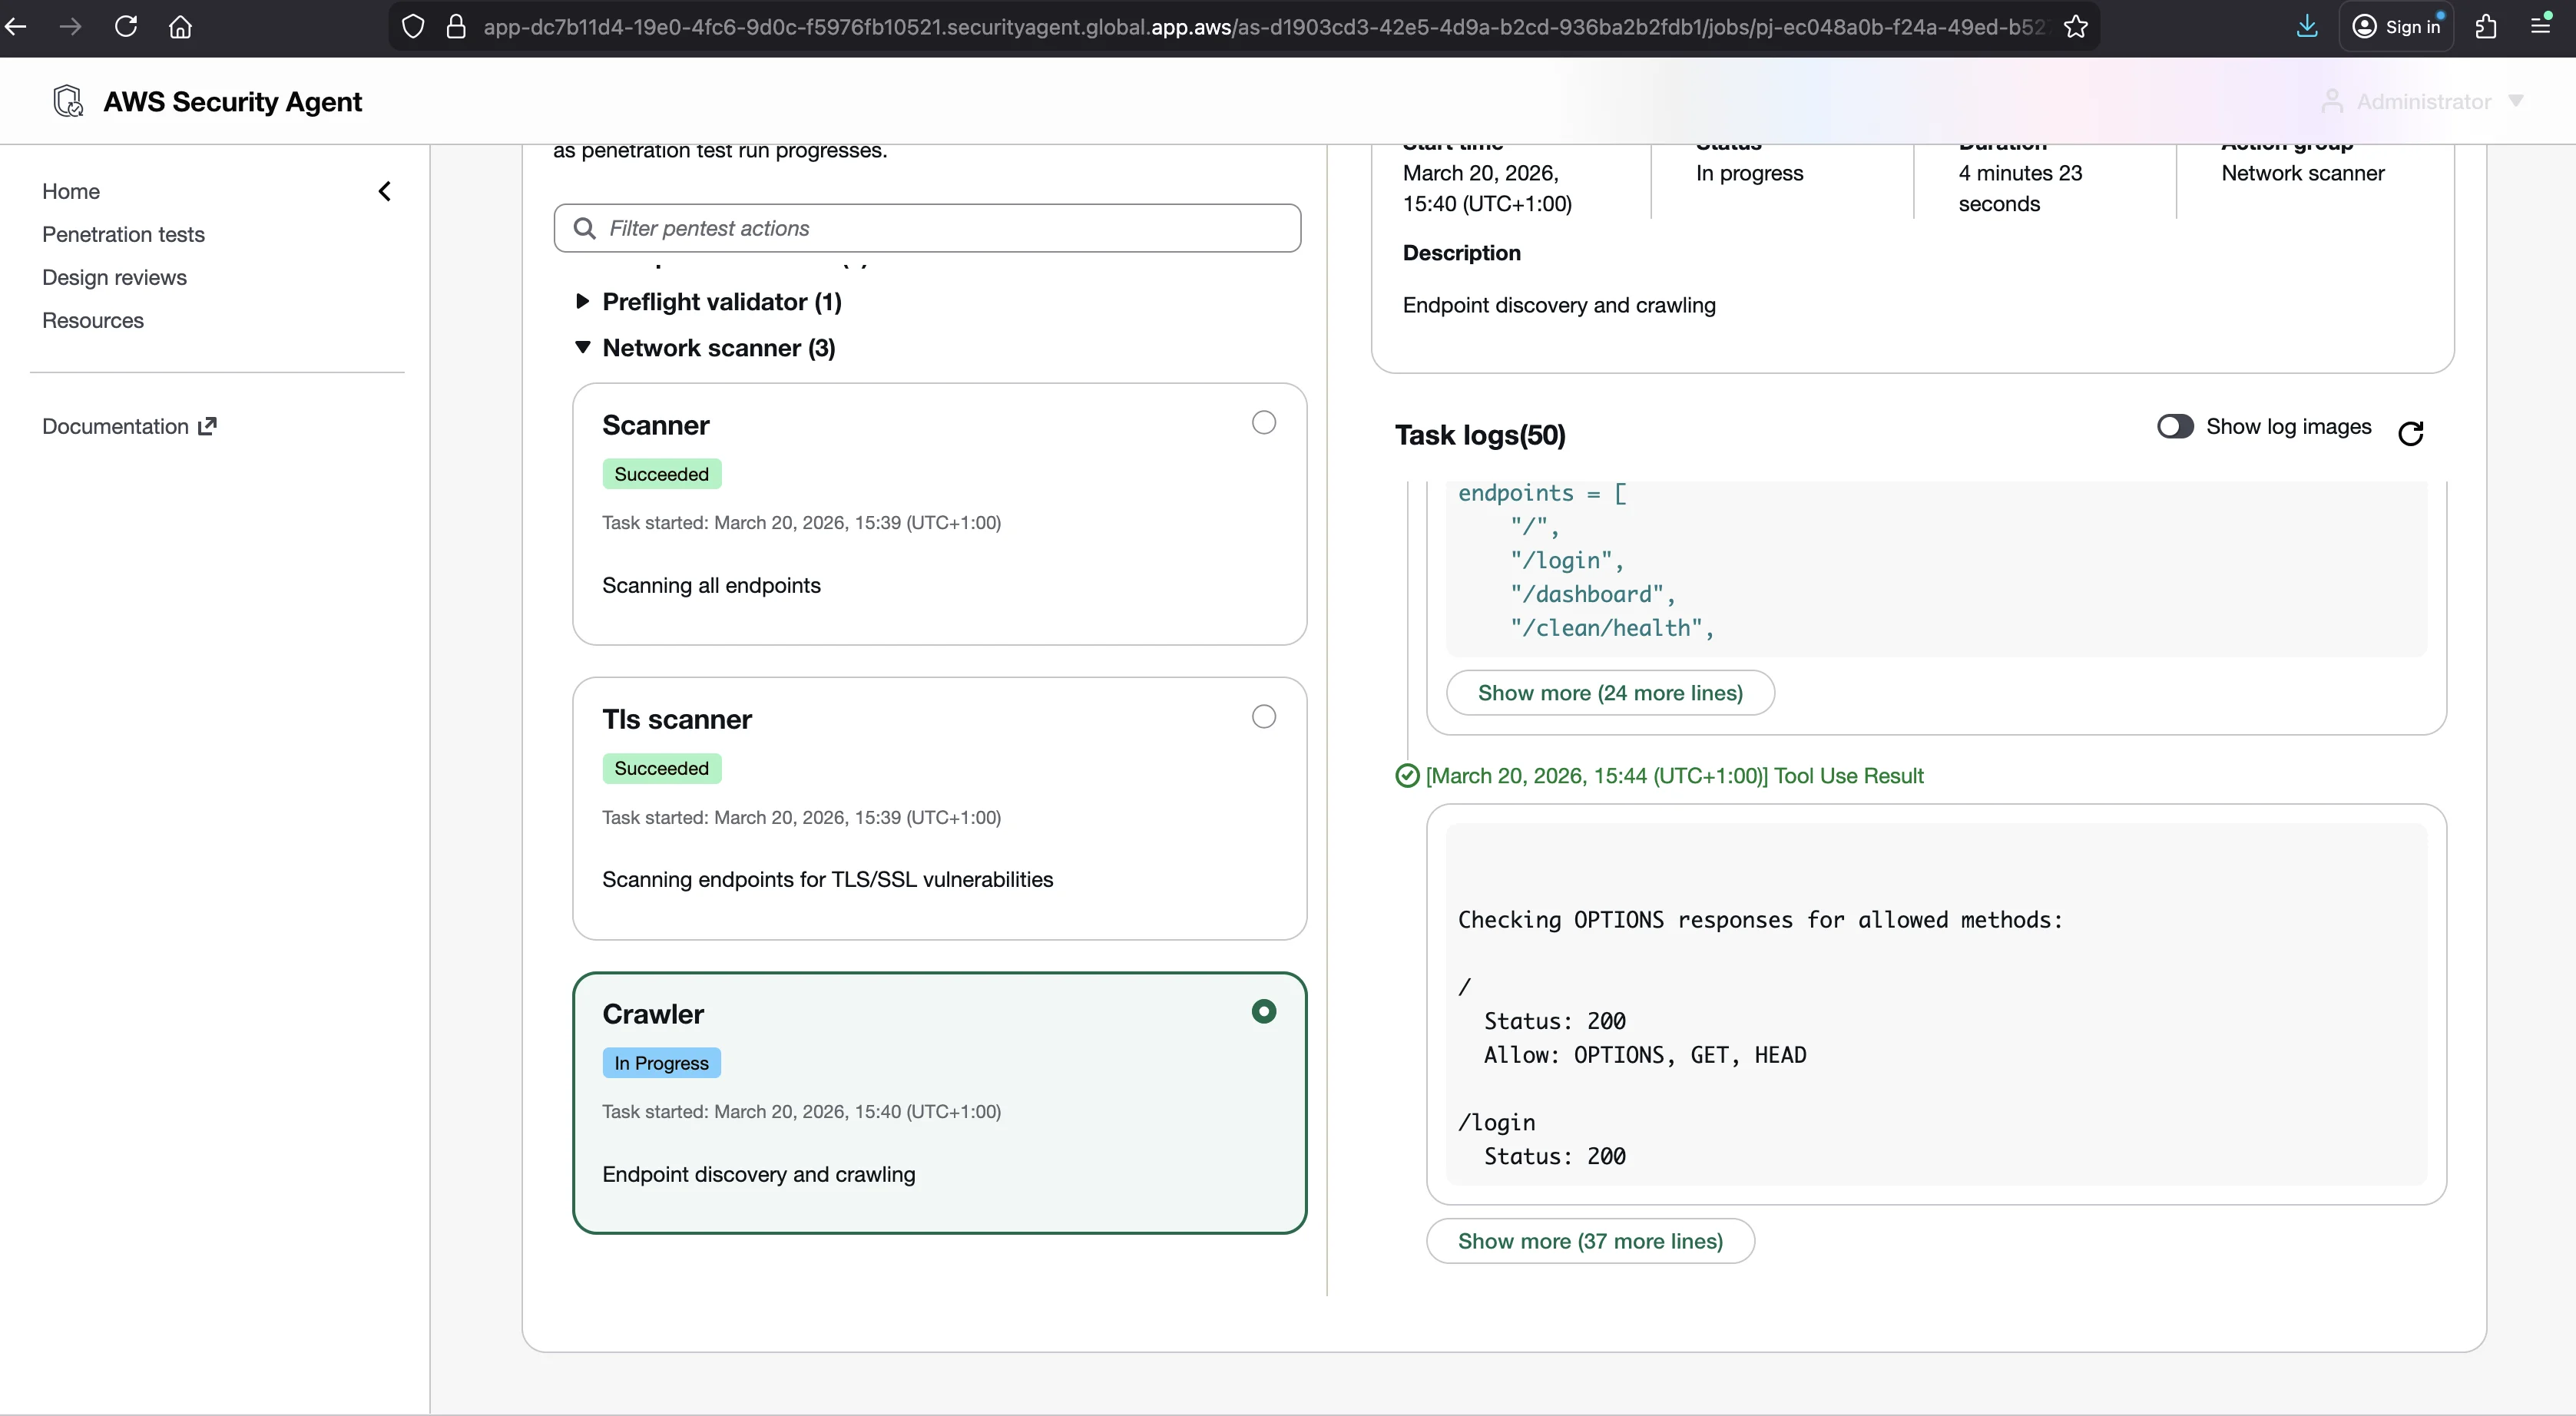
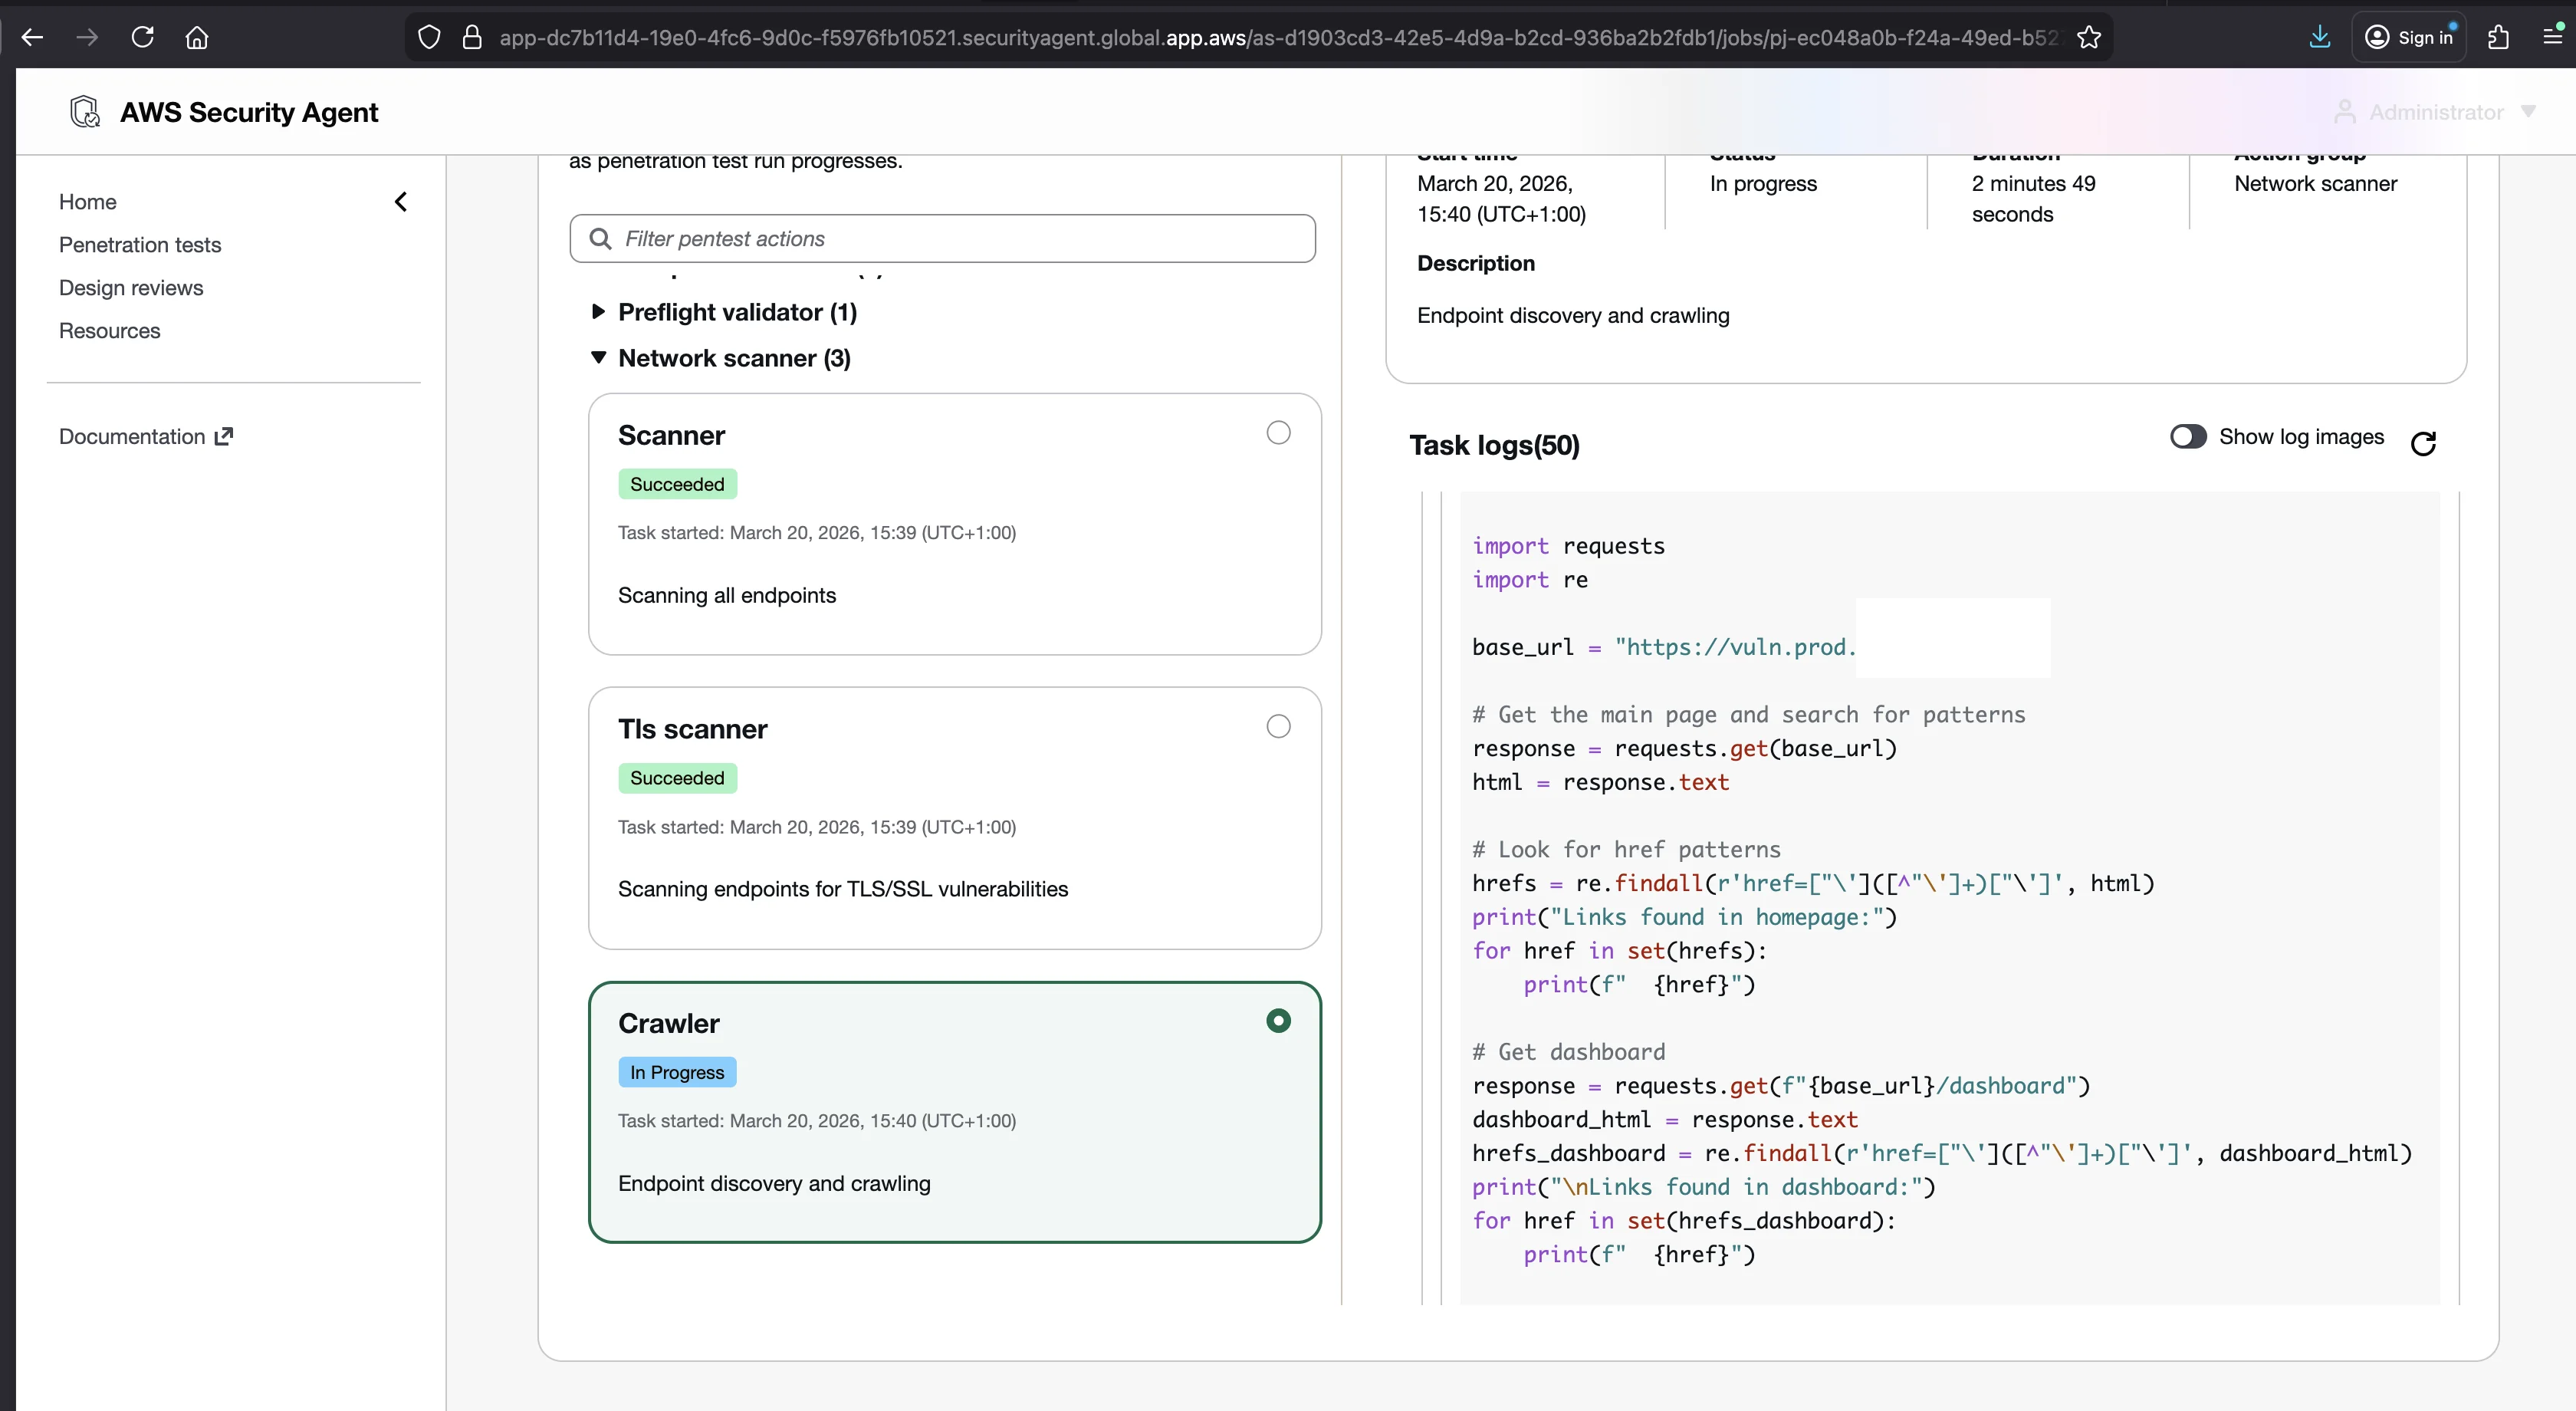
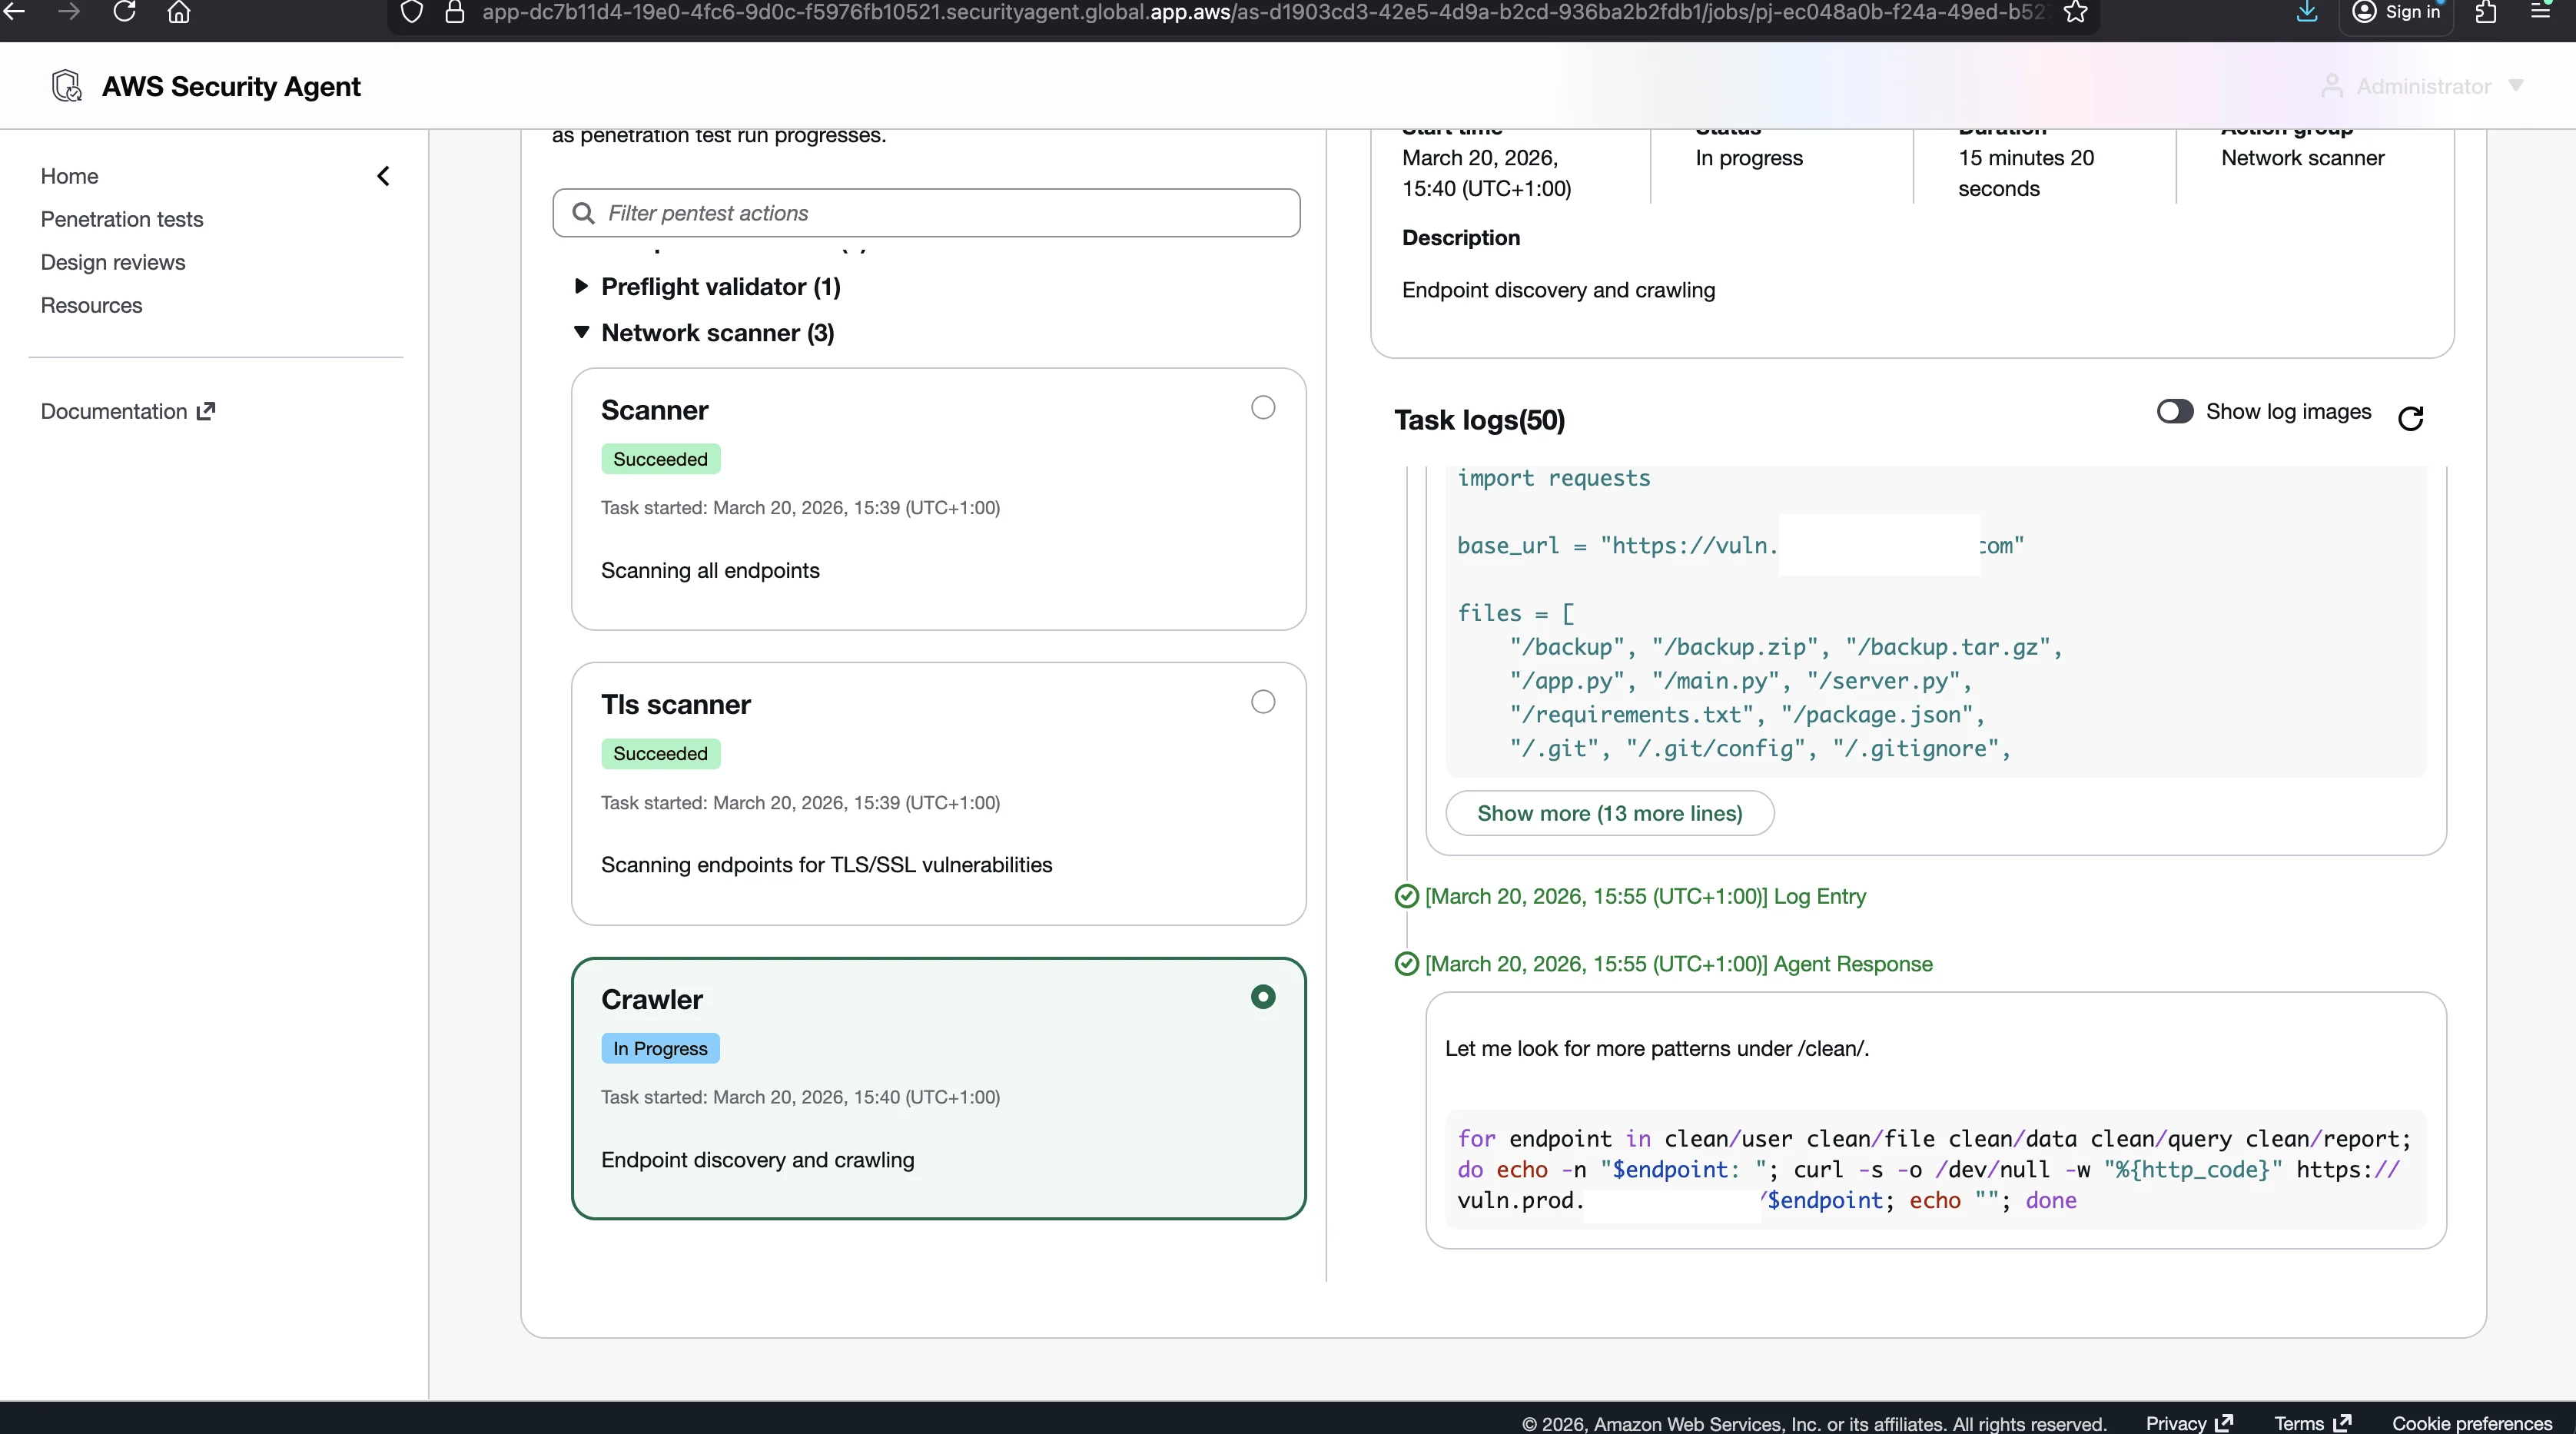
The Crawler is the one that matters most. Its job is to map the entire web application, and it is not a single agent. From the CloudWatch logs I found 12 internal sub-agent IDs inside the Crawler's log stream. It is a mini-swarm on its own, and it works with three kinds of tools: a real browser, curl, and custom Python it writes on the fly.
It started by opening a browser and visiting pages, clicking links and reading the DOM. Then it switched to curl, systematically checking the homepage, known endpoints, robots.txt (404), and sitemap.xml (404). Then it wrote Python to probe deeper:
import requests
import re

base_url = "https://vuln.lab.example.com"

# Get the main page and search for patterns
response = requests.get(base_url)
html = response.text

# Look for hrefs
hrefs = re.findall(r'href="([^"]*)"', html)
print("Links found in homepage:")
for href in set(hrefs):
    print(f"  {href}")
It tested common paths (/api, /api/v1, /admin, /config), tried login with test credentials (got 401), tested upload endpoints with different content types, checked OPTIONS methods on every endpoint it found, and ran a final verification pass.
The Crawler ran for about 16 minutes and discovered 10 routes. Of those, 7 are among the 48 scored endpoints the application actually exposes (the 2 upload vulnerability endpoints plus 5 clean endpoints), and the other 3 are unscored infrastructure pages: /, /login, and /dashboard. That is a scored-endpoint discovery rate of 7/48 = 14.6 percent (distinct from the vulnerability-endpoint discovery rate of 2/42 cited below). This number turns out to be the single biggest factor in the results, because everything the agent can attack depends on what the Crawler finds. If the Crawler does not discover an endpoint, no attack worker will ever test it.
Attack Workers and Validators
Once the Crawler hands over its map, specialized attack workers deploy in waves, each focused on one vulnerability type, each carrying purpose-built tooling. After the workers report potential findings, validator agents independently replay each attack from scratch rather than trusting the worker's report. On this run 7 candidate findings went to validators, and they rejected 5 of them as false positives (mostly JWT algorithm-confusion claims that did not hold up), confirming only 2. The dedicated post later in the series digs into the full agent inventory, the per-worker instructions, and the validator reasoning. For now the point is that the agent reasons, chains findings across risk types, and self-corrects its own false positives.
One detail worth flagging up front: as of May 2026, each confirmed finding now ships with an auto-generated, ready-to-run verification script, so you can reproduce the result yourself without reconstructing the attack by hand.
The Results
The run took 2 hours and 34 minutes. AWS does not publish a fixed maximum duration; a run scales with the size and scope of the application, and AWS frames cost in task-hours (about 24 task-hours for a typical comprehensive test) rather than wall-clock time. This run produced 47 CloudWatch log streams. The final report contained five findings: two verified, one at high confidence (an information-disclosure finding) and one at medium confidence (a path-traversal finding), plus three unverified (hidden by default in the PDF). The verified Information Disclosure finding came with a full CVSS vector, reproduction steps, and remediation guidance, all encrypted at rest with AWS KMS (the test logs themselves land in CloudWatch in my own account).
A full breakdown of these findings, including the per-finding CVSS scores and the validator reasoning behind each verdict, lives in the run-001 baseline summary.
The Discovery Bottleneck
My app has 48 scored endpoints: 39 distinct deliberately vulnerable ones across the 13 categories, each at three difficulty levels, occupying 42 endpoints because 3 of the hidden vulns use a 2-route chain, plus 1 login-support route (a backend auth endpoint, separate from the /login page) and 5 clean endpoints. The Crawler discovered 10 routes; of those, the 7 scored ones were the 2 upload vulnerability endpoints and the 5 clean endpoints, while the remaining 3 (/, /login, /dashboard) are unscored infrastructure pages. Through unaided crawling it reached none of the other 40 vulnerability endpoints. (Later in the run the agent did reach a few more by brute-forcing the weak JWT secret and chaining forged tokens into authenticated endpoints, but that produced no additional verified findings, as the Inside the Engine post details.) The reason the unauthenticated crawl stalled is mundane and realistic: nothing linked to those routes. No navigation links pointed to the vulnerable routes, no sitemap.xml existed, no robots.txt listed paths, and the index page did not catalog endpoints. Real applications do not advertise their attack surface either.
The result is two very different stories depending on how you measure. The run produced 5 findings total, of which 2 were validator-verified (AWS hides the other 3 as unverified by default). Four of those 5 findings mapped to distinct planted vulnerability categories; the 5th was an Information Disclosure on a clean endpoint (/clean/search) that does not correspond to any planted category. Counted against the planted grid, that is a detection rate of 4 of 39 distinct intentional vulnerabilities, 10.3 percent. Almost every vulnerability endpoint was never reached. The dominant limiter on this run was discovery, not detection: the Crawler reached only 2 of the 42 vulnerability endpoints, and the agent produced zero false positives on the clean endpoints. The problem on this run was not detection. It was discovery.
That has a practical fix, and it is exactly what the optional Step 4 resources are for: provide a sitemap.xml, upload an endpoint list as additional context, or connect your GitHub repo so the agent can read your route definitions. I did none of that here, because the goal of this first run was to see the unaided baseline.
What I Learned
Five findings from a 2.5-hour automated pentest, with zero false positives on clean endpoints and roughly half of the internal worker reports rejected by validators. The agent reasons about what it sees, self-corrects, chains findings across risk types, and cleans up after itself. The biggest limitation on this run was discovery: the agent tested every risk type across every endpoint it could reach, but it only reached 10 routes, just 7 of them among the 48 scored endpoints.
The fastest way to widen that reach is to give the agent more to work with. The next post does exactly that with one change, providing login credentials, and the findings go from 5 to 13.
Go Deeper: The State of AWS Security 2026
This article is just the start. Get the full picture with our free whitepaper - 8 chapters covering IAM, S3, VPC, monitoring, agentic AI security, compliance, and a prioritized action plan with 50+ CLI commands.
Toc Consulting: AWS Security & Cloud Architecture
Want expert help with AWS Security?
Our team helps engineering teams secure and architect AWS the right way: assessment in week one, a prioritized action plan in week two.
More Articles
KloudSec Is Live. This Is My Fight for Every Company That Isn't a Giant.
KloudSec, an agentless AWS security platform, is live. Why I built it, and why small and growing companies deserve the same protection as the largest ones.
The Verdict, Four Months Later
Part 16 of 16 in the AWS Security Agent: From Zero to Hero series. Closing the series: the numbers this whole project is built on, the honest verdict distilled to its essentials, what AWS has shipped since my hands-on testing, and an evidence-based look at how AI pentesting stacks up against traditional consultancy today.
The Agent's AWS Footprint
Part 15 of 16 in the AWS Security Agent: From Zero to Hero series. What AWS Security Agent leaves behind in your own account. CloudTrail events, Secrets Manager entries, and VPC Flow Logs, with the commands to audit and observe every run yourself.