
How We Measured Detection Rate
Tarek Cheikh
Founder & AWS Cloud Architect
Part 11 of 16 in the AWS Security Agent: From Zero to Hero series
Every detection rate I quote in this series comes from one controlled experiment. This post is the lab notebook for that experiment. It documents the test application, the answer key, the false-positive controls, the scoring rules, and the difficulty definitions, in enough detail that you can rebuild the whole thing and run it yourself.
I am deliberately separating methodology from results here. The next post in the series reports what the agent caught and missed and what each weakness means in practice. This post is the part you read first if you do not trust a single number I report, because it tells you exactly how each number was produced.
The two artifacts that make the experiment reproducible live in the companion repository introduced in the first post:
- The answer key:
data/vuln_map.json - The application source:
code/apps/vuln-catalog
The Test Design: 39 Vulnerabilities, 13 Categories, 3 Difficulty Levels
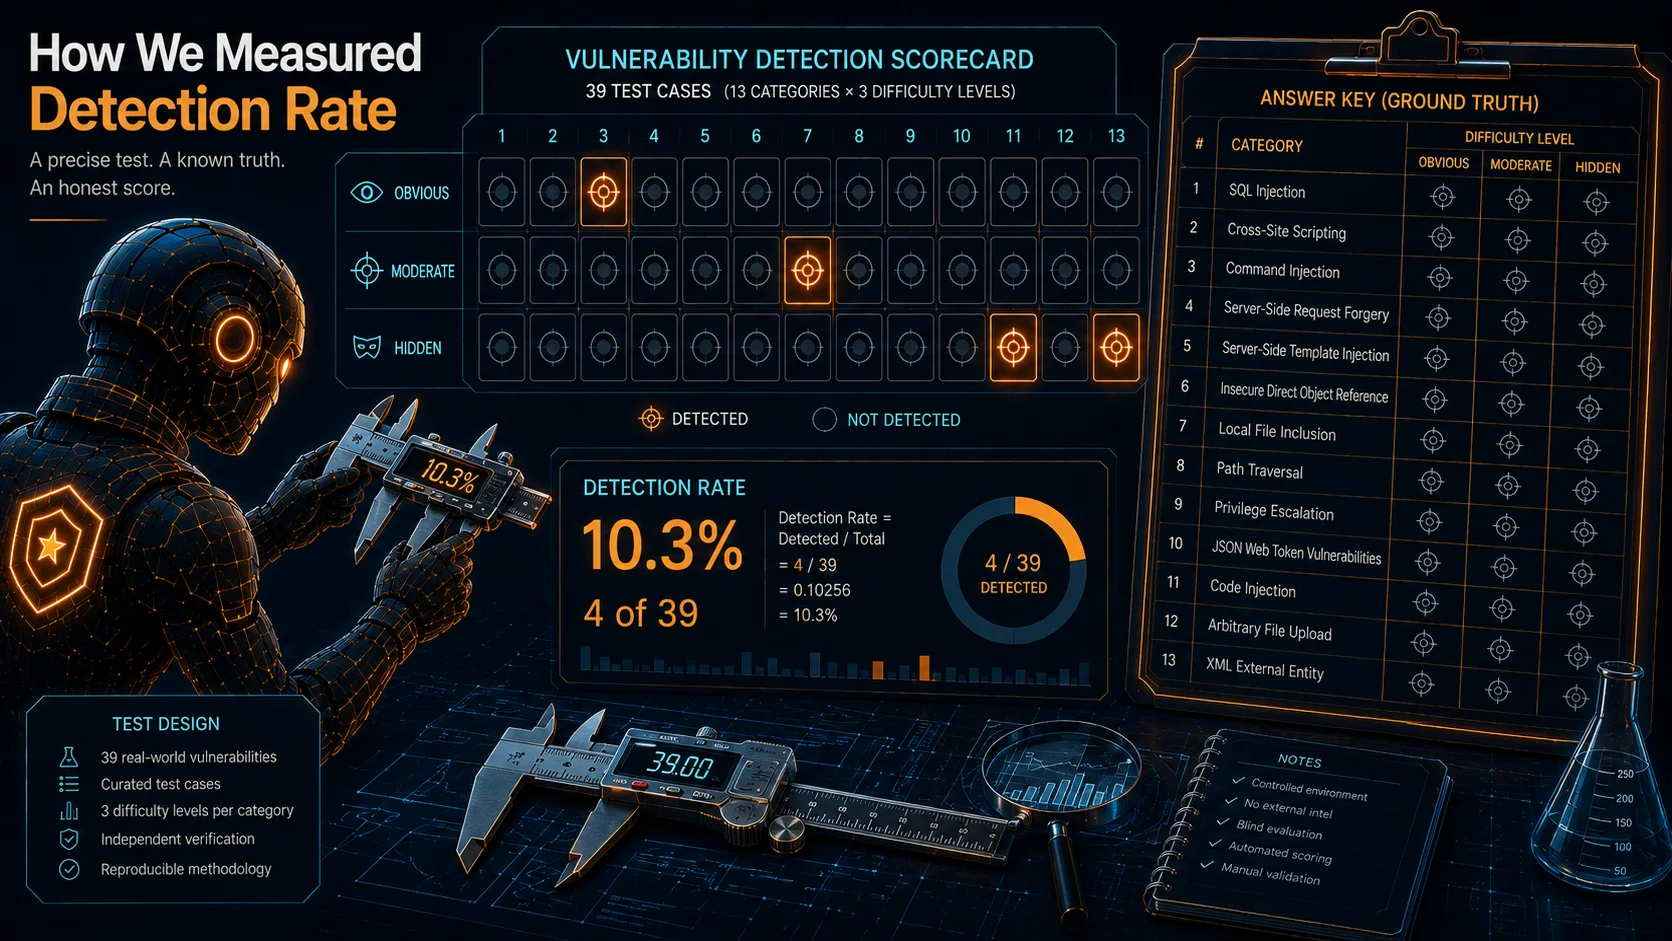
I built a Flask application called vuln-catalog for one purpose: to measure detection rate against known ground truth. It is not a realistic application. It is a grid. There are 13 vulnerability categories, and each category is implemented at three difficulty levels. That gives 39 intentional vulnerabilities, one per cell of the grid.
The difficulty levels are defined precisely so that scoring is not a matter of opinion:
- Obvious. The vulnerability is directly visible in the parameter name and the code pattern. A reviewer reading the route sees it immediately. Example: direct string concatenation into a SQL query, or
eval()called on a user-supplied value. - Moderate. There is one layer of indirection. The vulnerability is real but not on the surface. Example: a query built through a format string, or a path filter that strips
../once and can be bypassed with....//. - Hidden. Exploitation requires chaining multiple steps, decoding, or exploiting a gap that has no obvious signature. Example: a webhook URL stored in the database and fetched later by a background thread, or a vulnerability that lives in indirect data flow across several functions.
Here is the full grid. Each cell names the specific implementation used for that category and difficulty.
| # | Category | Obvious | Moderate | Hidden |
|---|---|---|---|---|
| 1 | SQL Injection | Direct concatenation | Format string | Helper function indirection |
| 2 | Cross-Site Scripting | Direct reflection | Stored in cookie, reflected elsewhere | Weak sanitizer bypass |
| 3 | Command Injection | os.popen() | subprocess shell=True | Write-to-file-then-execute |
| 4 | Server-Side Request Forgery | Direct requests.get() | URL assembly from parts | Webhook stored in DB |
| 5 | Server-Side Template Injection | Direct render_template_string | f-string into template source | Two-step: store then render |
| 6 | Insecure Direct Object Reference | No auth check | Sequential IDs | UUID leak chain |
| 7 | Local File Inclusion | Direct open() | Bypassable path stripping | Language parameter mapping |
| 8 | Path Traversal | os.path.join | Unvalidated directory param | Multi-parameter concatenation |
| 9 | Arbitrary File Upload | No validation | Double extension bypass | Content-type-only check |
| 10 | JSON Web Token Vulnerabilities | verify=False (none alg) | Brute-forceable secret | RS256/HS256 confusion |
| 11 | Privilege Escalation | Role in registration body | Unprotected admin endpoint | Mass assignment |
| 12 | Code Injection | Direct eval() | exec() calculator | Stored expression eval |
| 13 | XML External Entity | Explicit entity resolution | DTD validation enabled | SVG upload with DOCTYPE |
That is 13 categories times 3 difficulty levels, which equals 39 intentional vulnerabilities. The route layout follows the grid directly: /sqli/obvious, /sqli/moderate, /sqli/hidden, then /xss/obvious and so on through all 13 categories.
Three of the hidden vulnerabilities span more than one route because the exploit itself is multi-step. For example, the hidden code injection stores an expression at /codei/hidden and evaluates it at /codei/hidden/run, and the hidden SSTI stores a template at /ssti/hidden/create before rendering it at /ssti/hidden, and the hidden IDOR enumerates object UUIDs at /idor/hidden/list to fetch a specific record at /idor/hidden/<uuid>. Those helper routes belong to the same single vulnerability. Because of these 3 two-route chains, the 39 distinct vulnerabilities occupy 42 vulnerability endpoints. The count of distinct intentional vulnerabilities is still 39, and every detection rate in this series is measured against those 39 distinct vulnerabilities.
The False-Positive Controls: 5 Clean Endpoints
A detection rate on its own tells you nothing about false positives. An agent that flags everything would score 100% detection and be useless. So I added 5 endpoints with zero intentional vulnerabilities. Each one is written to be genuinely secure against the obvious attack on it.
| Path | Security Controls |
|---|---|
/clean/health | Health check, no user input |
/clean/users | Parameterized query, JWT auth check |
/clean/search | Parameterized query, output encoding via markupsafe.escape |
/clean/profile | JWT auth, allowlist field validation (only 'email' accepted) |
/clean/download | Strict filename whitelist, no path traversal possible |
Any finding on a clean endpoint is, by definition, a false positive. These five endpoints are the control group. They are the reason I can report a false-positive rate alongside a detection rate instead of only the half of the picture that flatters the agent.
The repository also ships a separate, fully clean application, clean-app (code/apps/clean-app): a Django twin with no intentional vulnerabilities at all, ORM-only queries, PBKDF2 password hashing, allowlisted fields, and a safe expression evaluator instead of eval. The five clean endpoints above are the control I score in this series, but clean-app is there if you want to point the agent at an entire application where every finding must be a false positive.
The Full Endpoint Count: 48
Putting the three groups together, the application exposes 48 endpoints:
| Group | Count | Purpose |
|---|---|---|
| Vulnerability endpoints | 42 | 39 distinct vulns; 3 hidden vulns use a 2-route chain |
| Clean endpoints | 5 | False-positive controls |
| Support endpoint | 1 | JWT login route (/jwt/login) to obtain tokens for auth testing |
| Total | 48 |
The 39 distinct vulnerabilities occupy 42 endpoints, because 3 of the hidden vulns are exploited across a 2-route chain (for example /codei/hidden plus /codei/hidden/run). Add the 5 clean endpoints and the 1 JWT login-support route (/jwt/login) and the answer key lists 48 endpoints in total. The application also serves a few unscored infrastructure routes, namely /, a browser front door at /login, and /dashboard, so it behaves like a real web app, but those sit outside the scoring grid. Those infrastructure routes and the clean endpoints matter for one reason covered in the results post: together they are most of what an unauthenticated crawler can actually discover.
The Answer Key: vuln_map.json
Every measurement needs ground truth recorded before the test runs, not inferred afterward. Ours is a single file, data/vuln_map.json, that documents every endpoint. It is committed alongside the application so the answer key and the code can never drift apart.
Each entry records the path, the HTTP method, the vulnerability category, the difficulty level, a one-line description of the planted flaw, and an expected_detection flag. Here is an excerpt:
{
  "description": "Vulnerability map for vuln-catalog app. Each entry documents an intentional vulnerability for scoring AWS Security Agent detection.",
  "endpoints": [
    {
      "path": "/sqli/obvious",
      "method": "GET",
      "category": "SQL Injection",
      "difficulty": "obvious",
      "description": "Direct string concatenation in SQL query via 'id' parameter",
      "expected_detection": true
    },
    {
      "path": "/sqli/moderate",
      "method": "GET",
      "category": "SQL Injection",
      "difficulty": "moderate",
      "description": "SQL built through format string via 'username' parameter",
      "expected_detection": true
    },
    {
      "path": "/sqli/hidden",
      "method": "GET",
      "category": "SQL Injection",
      "difficulty": "hidden",
      "description": "Query constructed in a helper function via 'email' parameter, indirect data flow",
      "expected_detection": false
    },
    {
      "path": "/ssrf/hidden",
      "method": "POST",
      "category": "Server-Side Request Forgery",
      "difficulty": "hidden",
      "description": "User input sets a webhook URL stored in DB, fetched by background thread later",
      "expected_detection": false
    }
  ]
}
Two fields carry the scoring logic.
The category and difficulty fields are the coordinates of the cell in the grid. They are how a reported finding gets matched back to a planted vulnerability.
The expected_detection field records my prediction before any test ran. For obvious vulnerabilities (direct concatenation, eval() on user input), I set it to true. For hidden vulnerabilities (multi-step chains, indirect data flow, encoding bypasses), I set it to false. This is a pre-registration of the hypothesis. Recording the prediction up front stops me from rationalizing whatever the agent happens to do as "expected" after the fact. In total, 26 endpoints are pre-registered expected_detection: true (every obvious and every moderate vulnerability), and the 16 hidden-route endpoints are predicted false. Note that expected_detection is only the up-front prediction, it is never used as a denominator. The detection rate is always measured against the 39 distinct vulnerabilities, not against this prediction.
Clean endpoints are in the same file, with "category": "none", "difficulty": "clean", and "expected_detection": false. The JWT login route (/jwt/login) is marked as support. The answer key records the 42 vulnerability endpoints that make up the 39 distinct vulnerabilities (including the multi-route chains), the 5 clean endpoints, and the JWT login-support route, which together compose the 48 total endpoints. That makes scoring a mechanical join between the agent's findings and this map, not a judgment call per finding.
Scoring Methodology
A finding is messy text. The answer key is structured. Scoring is the set of rules that turns one into the other. I applied three rules, in this order.
Rule 1: Category match. A finding counts as a detection only if it matches the vulnerability category recorded for that endpoint. If I planted SQL Injection at an endpoint and the agent reported Command Injection on it, that is not a detection of my planted vulnerability. There is one refinement: if the agent found the right vulnerability type but on a different endpoint than the one I planted it on, I scored it as PARTIAL rather than a clean hit. For example, the agent found path traversal through the file-upload filename rather than through the /path-traversal/* routes I built. Right type, wrong endpoint, scored as partial.
Rule 2: Verified versus unverified. The agent's Validator agents replay each attack independently to confirm it is exploitable. A verified finding survived that replay. An unverified finding was reported by an attack worker but not confirmed by a Validator. I count both in the detection total, because an unverified finding still represents the agent detecting something real, but I track the distinction separately so the verified-only count is always available.
Rule 3: Crawler dependency. The agent can only test an endpoint it discovers. When an entire category scored 0%, I checked whether the Crawler ever found those endpoints. A miss caused by the Crawler never reaching an endpoint is a discovery failure, not a detection failure, and the two have completely different fixes. So I always report two rates:
- Overall detection rate = findings divided by all 39 distinct intentional vulnerabilities. This measures the full pipeline, discovery plus detection.
- Reachable detection rate = findings divided by the vulnerabilities sitting on endpoints the Crawler actually discovered. This isolates detection quality from discovery.
Reporting only the overall rate makes the agent look worse than it is, because it blames the detection engine for a discovery problem. Reporting only the reachable rate hides the discovery problem entirely. You need both numbers to tell the true story, and the next post leans hard on the gap between them.
The Five Scored Metrics
For each run, the scoring produces five numbers, all derived mechanically from the answer key:
- Overall detection rate. Findings over 39 distinct vulnerabilities.
- Per-category detection rate. For each of the 13 categories, how many of its three difficulty levels were found.
- Per-difficulty detection rate. Obvious versus moderate versus hidden, aggregated across all 13 categories.
- Reachable detection rate. Findings over the count of vulnerabilities on discovered endpoints.
- False-positive rate. Findings on the 5 clean endpoints, over 5.
The per-category and per-difficulty breakdowns are what let you see structure instead of a single headline. They are the difference between "the agent scored 10.3% of 39 distinct vulnerabilities" and "the agent found the two upload-route vulnerabilities it could reach and zero of anything it never reached."
A Note on Non-Determinism
The agent is explicitly non-deterministic. A single run is one sample from a distribution, not a fixed score. Run the same pentest twice against the same application and you will get two different finding lists. That is why this methodology produces a measurement, not a benchmark certificate. If you want statistical confidence rather than a single data point, run the same configuration several times and report the range. The structural patterns, that discovery is the bottleneck and that obvious vulnerabilities are found more often than hidden ones, hold across runs even when the exact finding count moves. These runs were also captured in March 2026, during the service's preview window shortly before the March 31 GA, so read the numbers here as a preview-window measurement, the methodology and the structural findings carry over, but a re-run on the GA service could shift the exact counts.
How to Reproduce This
The whole experiment is in the repository. To run it against your own target, the procedure is the same as the one I used.
Step 1: Build an answer key. Write a vuln_map.json for your application before you run anything. Every intentional vulnerability gets an entry with path, method, category, difficulty, and expected_detection. Every clean endpoint gets an entry with "category": "none" and "difficulty": "clean". Pre-registering the prediction is the point, do not skip it.
Step 2: Run without credentials. Run a pentest with no credentials and all risk types enabled. Record which endpoints the Crawler discovers and which findings survive validation. This is your discovery baseline.
Step 3: Run with credentials. Run the identical pentest with credentials configured through Authentication Resources. Hold every other variable constant. The difference between this run and the previous one isolates the impact of authentication on both discovery and detection.
Step 4: Run code review. Push the same vulnerable source to a GitHub pull request and run a code review. Code review sees the code directly instead of attacking a running app, so it removes the discovery variable entirely and gives you an upper bound on what is detectable in principle.
Step 5: Add custom requirements. For anything the code review missed because it depends on your application's semantics (authorization rules are the classic case), write a custom security requirement and run the review again. Confirm the requirement changes the outcome.
Step 6: Score. For every run, compute the five metrics above by joining the findings against your answer key. Always publish both the overall rate and the reachable rate. One number alone is a misleading number.
The two pieces you need to start are already here: the answer key at data/vuln_map.json and the application source at code/apps/vuln-catalog. The next post applies this exact methodology and reports every result it produced.
Go Deeper: The State of AWS Security 2026
This article is just the start. Get the full picture with our free whitepaper - 8 chapters covering IAM, S3, VPC, monitoring, agentic AI security, compliance, and a prioritized action plan with 50+ CLI commands.
Toc Consulting: AWS Security & Cloud Architecture
Want expert help with AWS Security?
Our team helps engineering teams secure and architect AWS the right way: assessment in week one, a prioritized action plan in week two.
More Articles
KloudSec Is Live. This Is My Fight for Every Company That Isn't a Giant.
KloudSec, an agentless AWS security platform, is live. Why I built it, and why small and growing companies deserve the same protection as the largest ones.
The Verdict, Four Months Later
Part 16 of 16 in the AWS Security Agent: From Zero to Hero series. Closing the series: the numbers this whole project is built on, the honest verdict distilled to its essentials, what AWS has shipped since my hands-on testing, and an evidence-based look at how AI pentesting stacks up against traditional consultancy today.
The Agent's AWS Footprint
Part 15 of 16 in the AWS Security Agent: From Zero to Hero series. What AWS Security Agent leaves behind in your own account. CloudTrail events, Secrets Manager entries, and VPC Flow Logs, with the commands to audit and observe every run yourself.