
Inside the Engine: What the Logs Reveal
Tarek Cheikh
Founder & AWS Cloud Architect
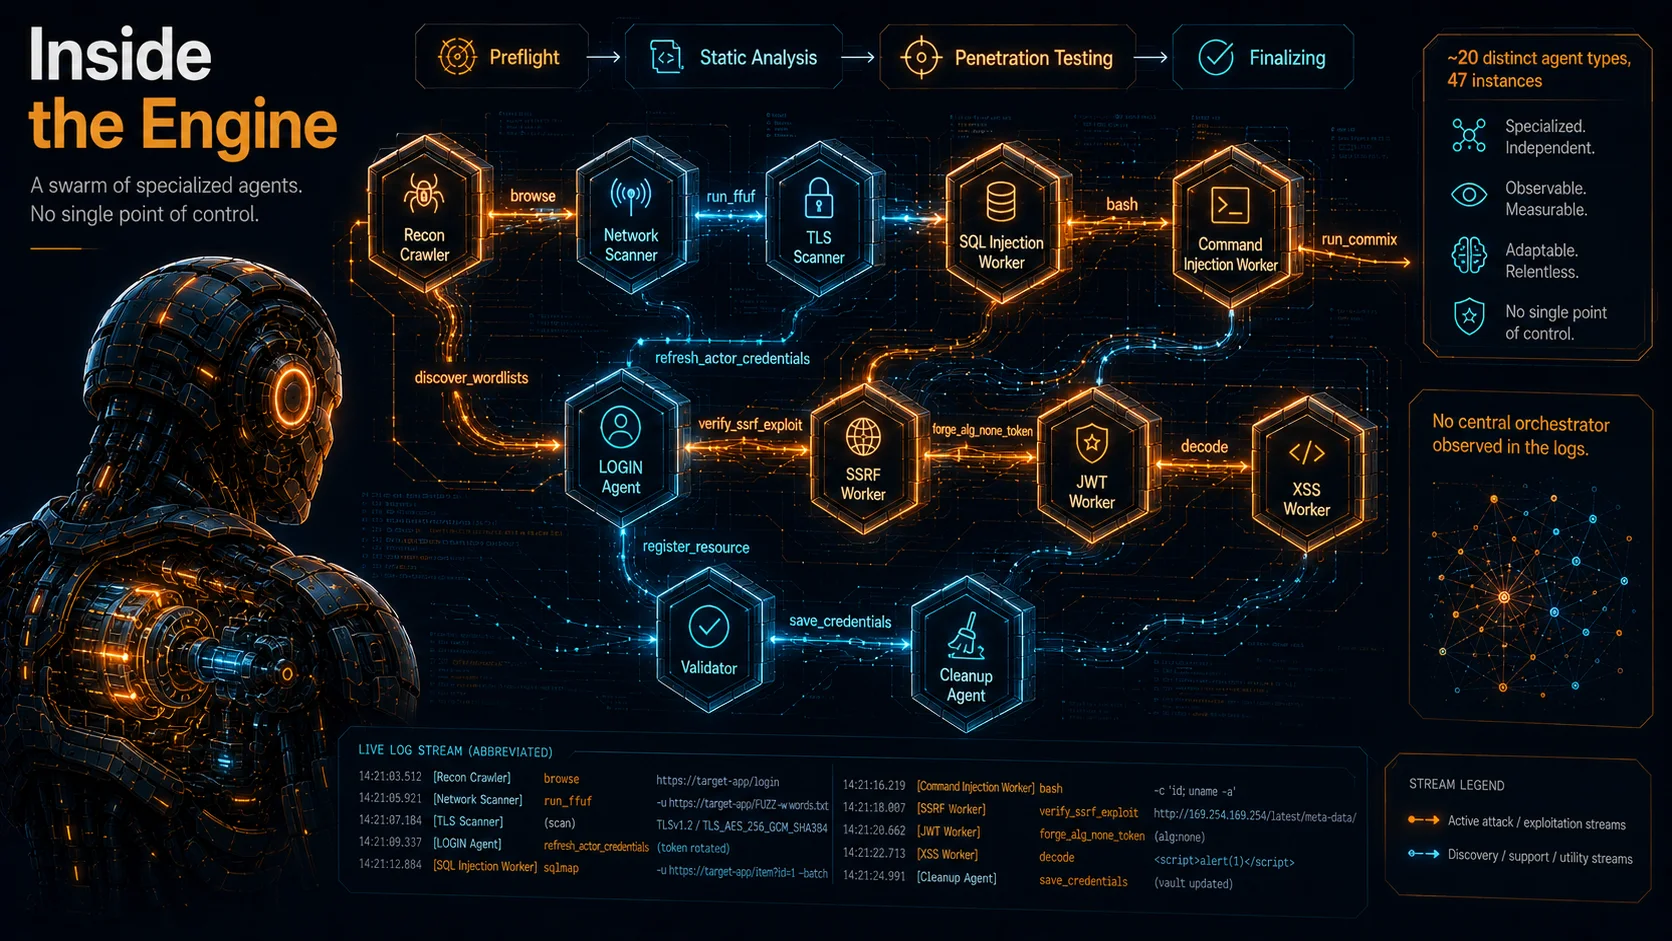
The earlier posts in this series showed you what AWS Security Agent finds. This one is about how it works. Every penetration test writes every action to CloudWatch Logs in your own account, and I downloaded all of it. What follows is built entirely from those logs: every count, every code block, every quote comes straight out of the log streams from my two pentest runs. Both runs were captured in March 2026, during the preview window before the March 31 GA, and AWS does not publish its internal agent, tool, or phase counts, so treat the exact internal shape below as what I observed then; the architecture it maps to is unchanged at GA.
The PDF report tells you what the agent found. The CloudWatch logs tell you how it thinks.
How the Logs Are Structured
Each pentest writes to a CloudWatch log group you specify during setup. Inside that group, every agent instance gets its own log stream. AWS does not publish the stream-name format, but the names I saw all followed this pattern:
agentspace/AGENT_TYPE-jobid-taskidMy first run (run-001, no credentials) produced 47 streams totaling 7.1 MB. My second run (run-002, with credentials) produced 57 streams totaling 8.6 MB. You can download all of it through the AWS Console or the CLI.
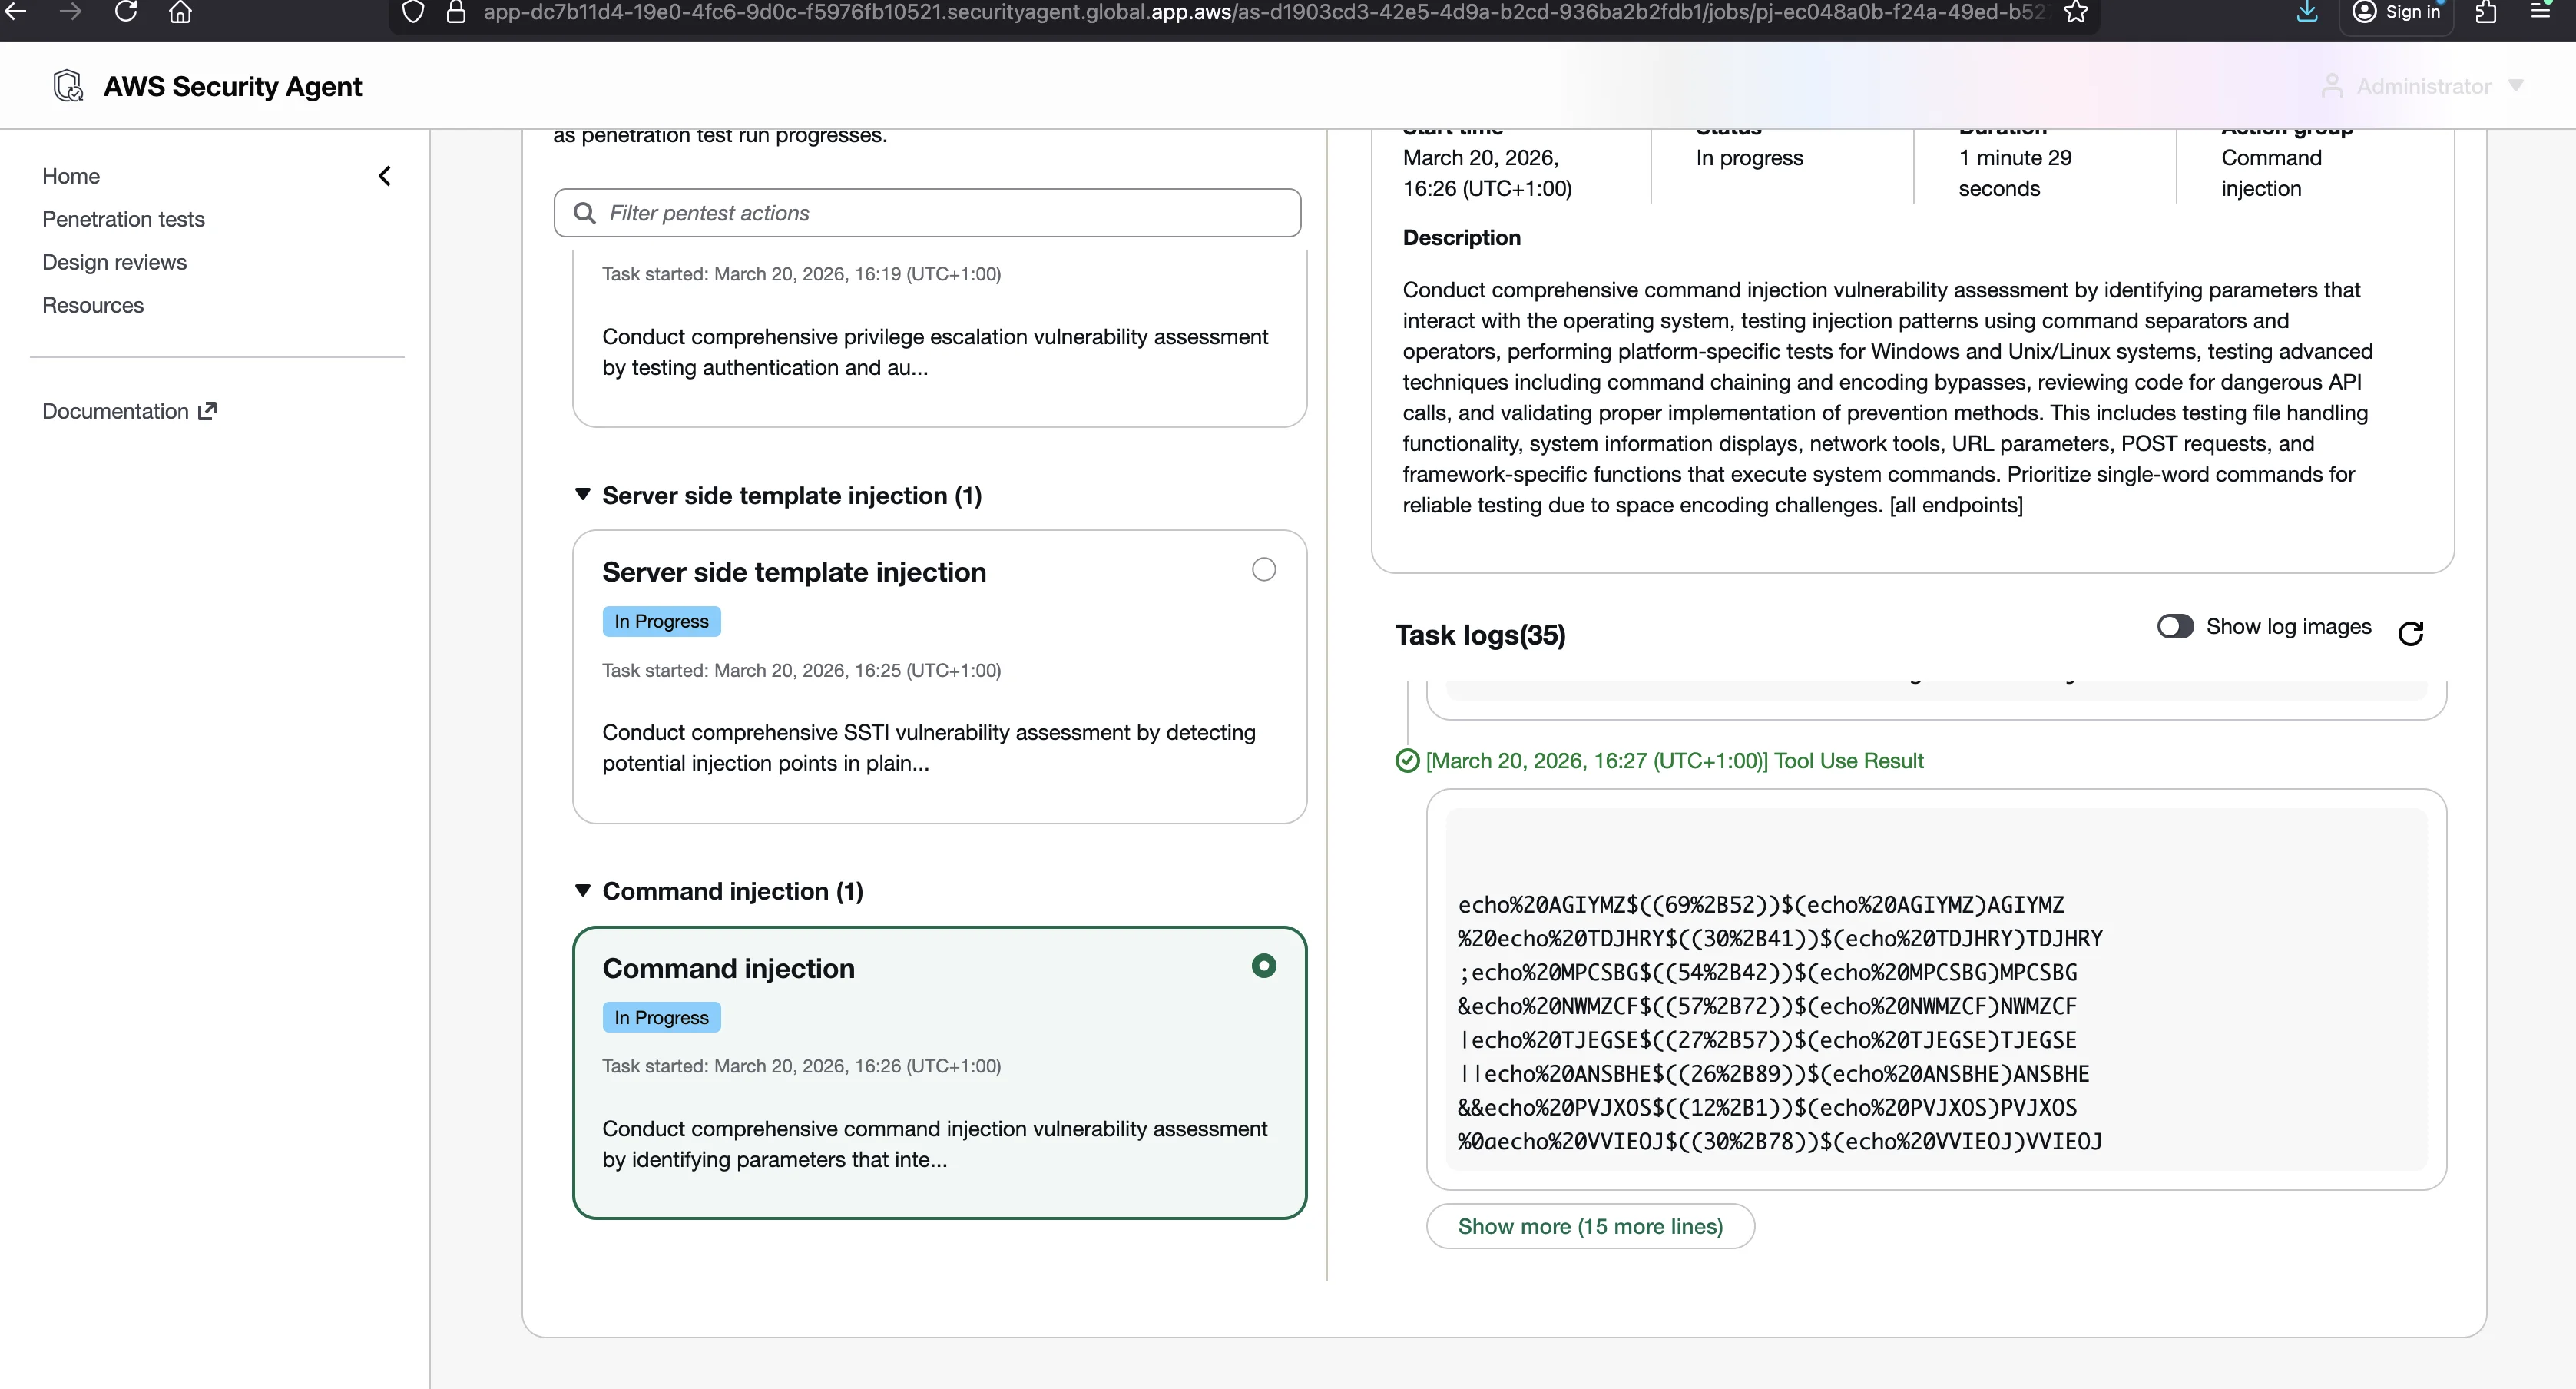
The results are KMS-encrypted and stored in CloudWatch in your own account, which is exactly what makes this kind of analysis possible. Nothing here required special access. It is your data.
What a Single Log Event Looks Like
Each event is a JSON object containing the agent's ID, an interaction number, and the full response: both the agent's reasoning (text) and whatever tool it called. Here is one real event from the LOGIN agent navigating to a login page:
{
  "timestamp": 1774055562,
  "interaction_number": 2,
  "agent_id": "43ca04a1-...",
  "response": {
    "content": [
      {
        "type": "text",
        "text": "I'll start by navigating to the login page."
      },
      {
        "type": "tool_use",
        "name": "browse",
        "input": {
          "browser_input": {
            "action": {
              "type": "navigate",
              "url": "https://vuln.lab.example.com/login"
            }
          }
        }
      }
    ],
    "role": "assistant"
  }
}
Every event follows this pattern. The agent thinks in text, then calls a tool. The text block is the model reasoning, so you can read the agent's thought process as it decides what to do next. The tool_use block is the action it takes. Across run-001 I counted roughly 2,260 reasoning blocks and roughly 2,966 tool calls.
That is the unit of observation for everything below. When I say the agent "reasoned" about something, I mean there is a text block in the logs where it said so before acting.
The 14 Tools
Across both runs the agent used 14 distinct tools. This is not a hypothetical list. Every row in the table comes from counting actual tool_use events in the logs: eleven appear in both runs, run_commix appears only in run-001, and save_credentials and read_file appear only in run-002 (the authenticated run). The Uses column below is the run-001 count, since that is the run the rest of this article's log analysis is drawn from.
| Tool | Uses (run-001) | What it does |
|---|---|---|
| bash | 1,377 | curl commands, system enumeration, file operations |
| python | 934 | Writes and executes custom Python scripts |
| browse | 556 | Real browser: clicks, fills forms, reads DOM |
| verify_ssrf_exploit | 34 | Out-of-band SSRF verification via DNS callbacks |
| sqlmap | 15 | The actual sqlmap tool for automated SQL injection testing |
| run_ffuf | 14 | Directory and path fuzzing with wordlists |
| refresh_actor_credentials | 11 | Refresh authentication tokens mid-test |
| discover_wordlists | 9 | Find available wordlists for fuzzing |
| register_resource | 8 | Register artifacts (uploaded files, modified data) for cleanup |
| forge_alg_none_token | 4 | Forge JWT tokens with algorithm set to "none" |
| run_commix | 2 | Automated command injection testing, run-001 only |
| decode | 2 | Base64 and encoding operations |
| save_credentials | run-002 only (2 uses) | Save cookies and HTTP headers for other agents |
| read_file | run-002 only (1 use) | Read a locally saved file, such as downloaded HTML, back into context |
Two numbers stand out. bash plus python account for 78 percent of all tool calls. The agent primarily works by writing and running its own code, not by invoking specialized scanners. The browse tool at 556 uses (19 percent) means the agent operates a real browser: it navigates pages, fills form fields, clicks submit buttons, and reads the resulting DOM. This is not headless curl. It is a genuine browser being driven, behavior consistent with a Playwright or CDP-style automation layer.
The specialized tools reveal the structure underneath. Each attack worker gets a tailored toolkit. The SQL Injection worker gets sqlmap. The Command Injection worker gets commix. The SSRF worker gets verify_ssrf_exploit for DNS callback verification. The JWT worker gets forge_alg_none_token. The XSS worker leans on browse, because DOM-based cross-site scripting requires a real browser to detect at all.
The Agent Writes and Runs Its Own Code
The fact that bash and python dominate is the single most important thing the logs show. The agent is not picking payloads off a list. It writes programs, runs them, reads the output, and decides what to do next.
Here is one real script from the logs. The reconnaissance crawler wrote this to verify which endpoints exist and what HTTP methods they accept:
import requests

base = "https://vuln.lab.example.com"
paths = ["/api", "/api/v1", "/admin", "/config",
         "/logout", "/signup", "/forgot-password",
         "/clean/health", "/clean/search", "/clean/users",
         "/clean/profile", "/clean/download",
         "/upload/obvious", "/upload/hidden"]

for path in paths:
    try:
        r = requests.get(f"{base}{path}", timeout=5)
        print(f"GET {path} -> {r.status_code}")
    except Exception as e:
        print(f"GET {path} -> ERROR: {e}")

    try:
        r = requests.options(f"{base}{path}", timeout=5)
        allow = r.headers.get("Allow", "N/A")
        print(f"  OPTIONS -> {r.status_code}, Allow: {allow}")
    except:
        pass
The same agent also checked for sitemap.xml, robots.txt, .env files, backup.zip, and .git/config, crawled HTML for links using regex, and probed common admin paths. It is not a simple link follower. It is a multi-phase discovery system that builds and runs tooling on the fly.
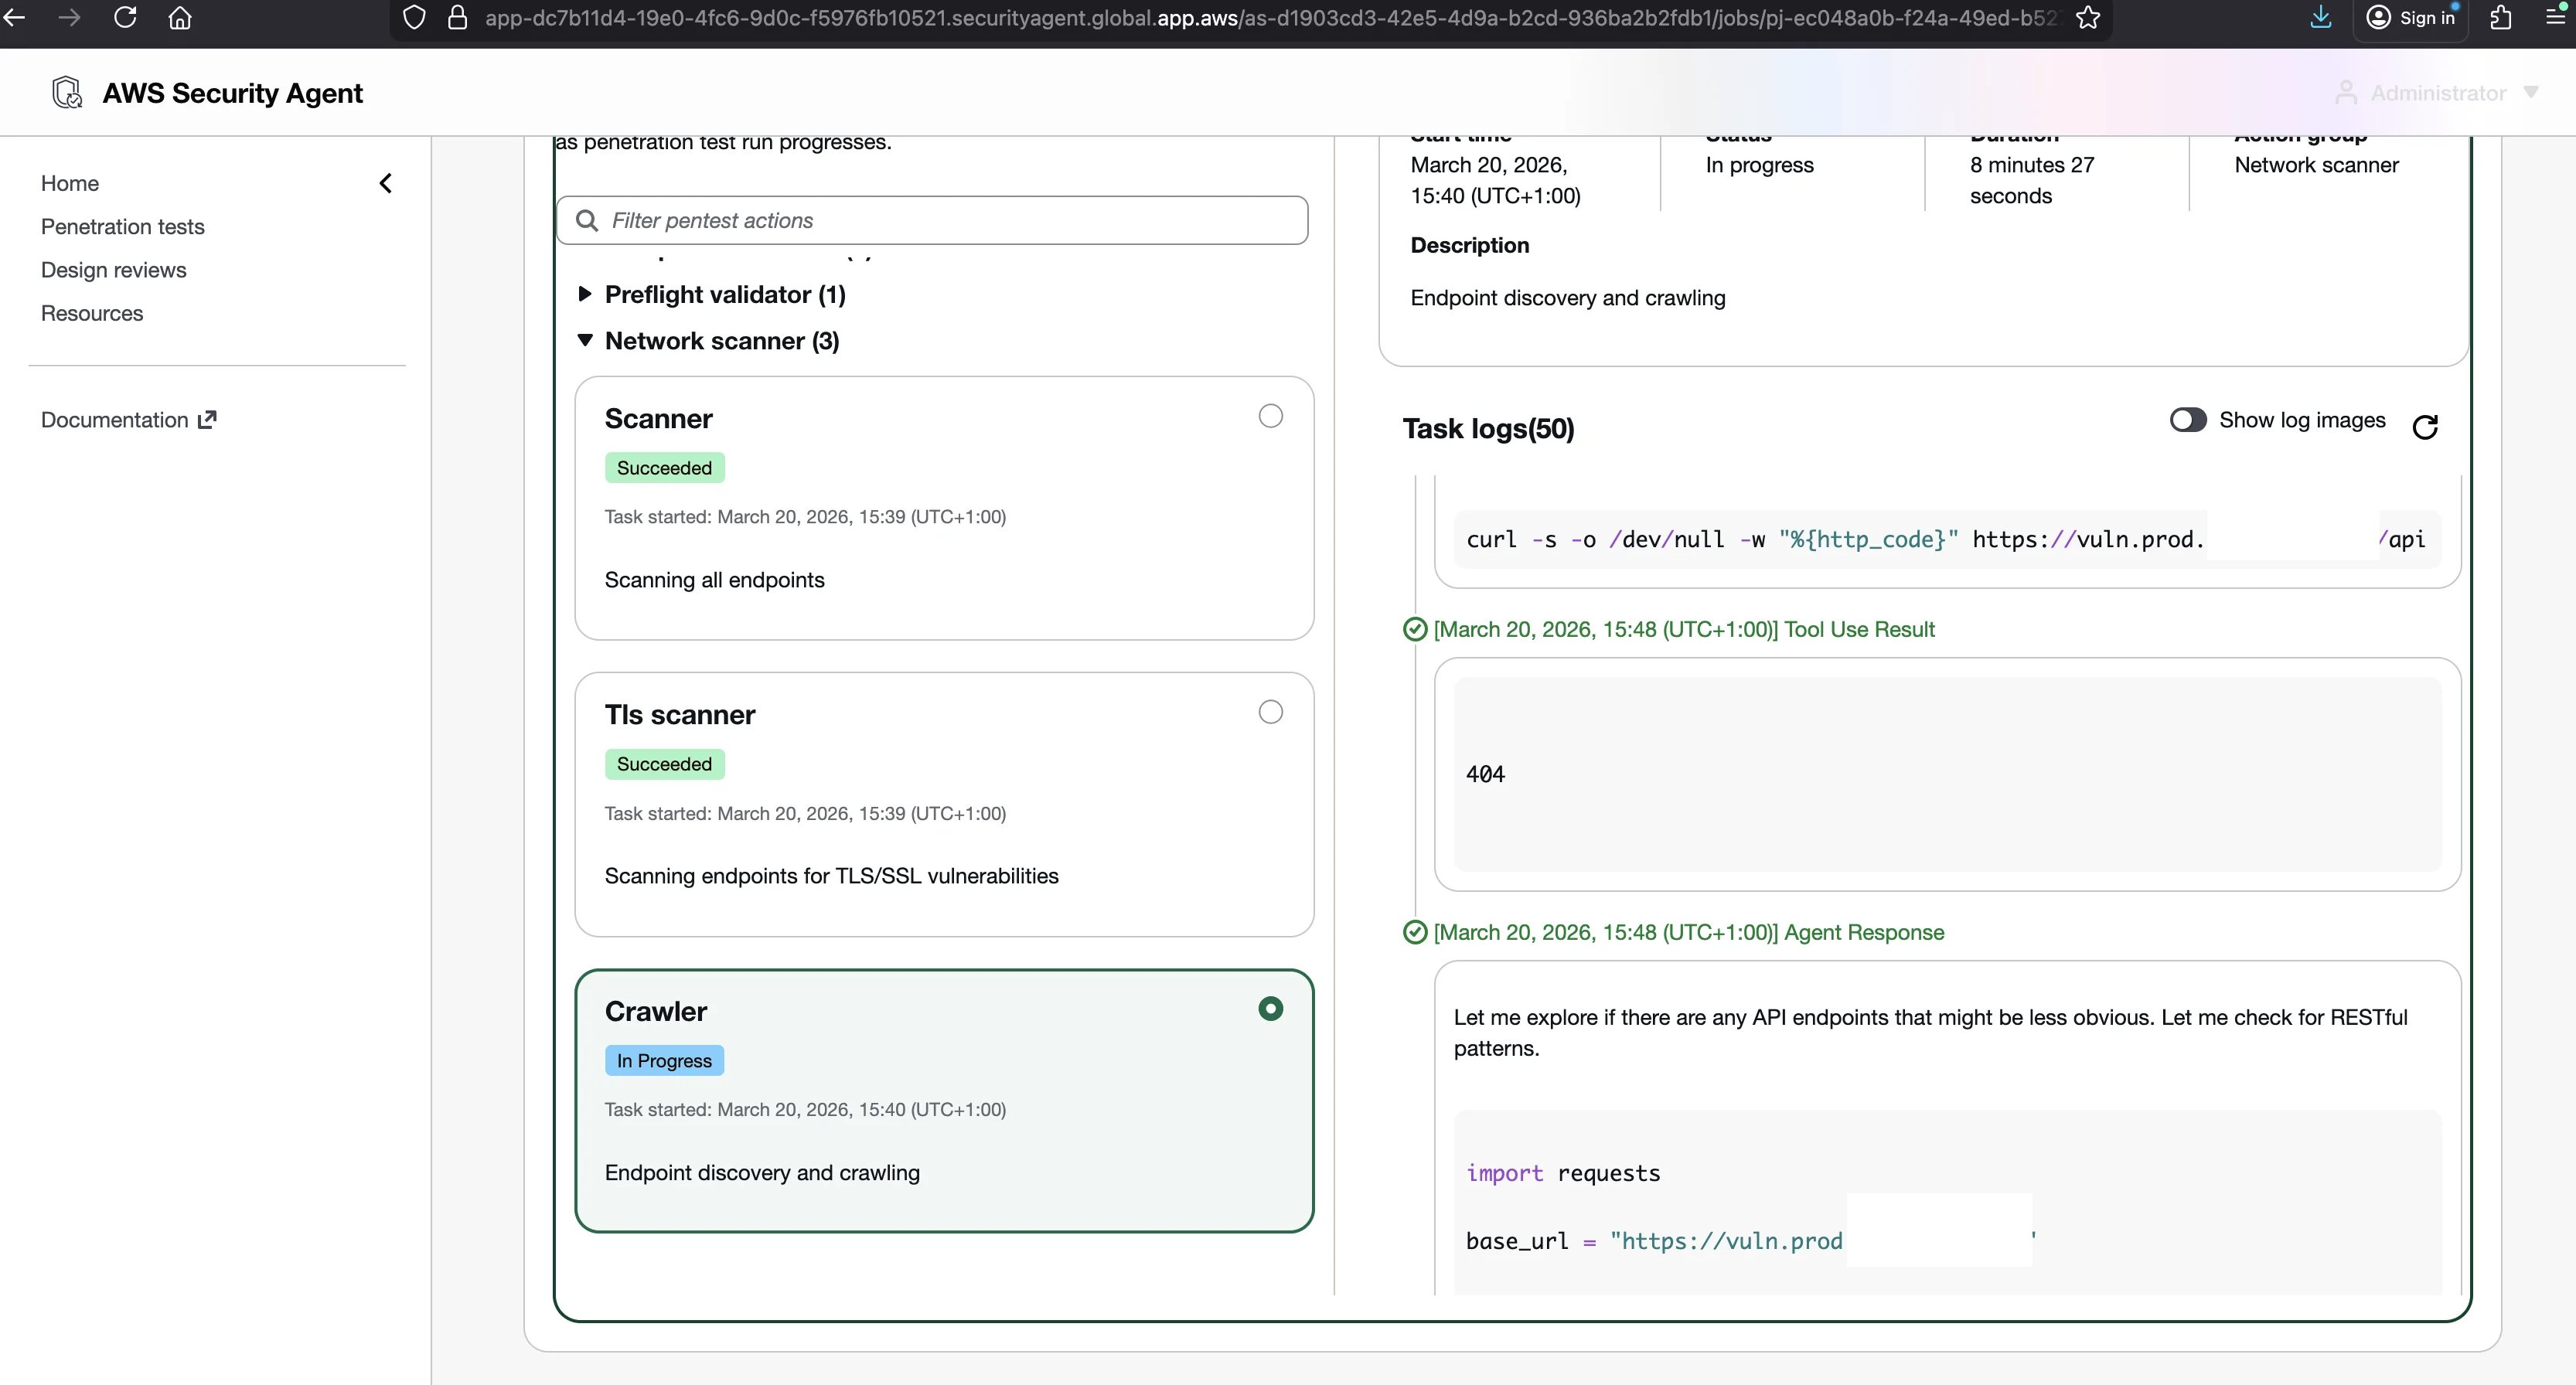
That crawler ran for about 16 minutes and produced 1,290 log events, more than any other single agent in the run. After its initial browser exploration phase, it switched to writing and executing Python scripts for systematic endpoint discovery. Internally it spawned 12 sub-agent IDs within its single log stream: after the main probing finished, 11 more sub-agents launched in parallel, each using the browser to explore different parts of the application simultaneously. The crawler is itself a mini-swarm.
What the Logs Show: Agent Types, Instances, and Phases
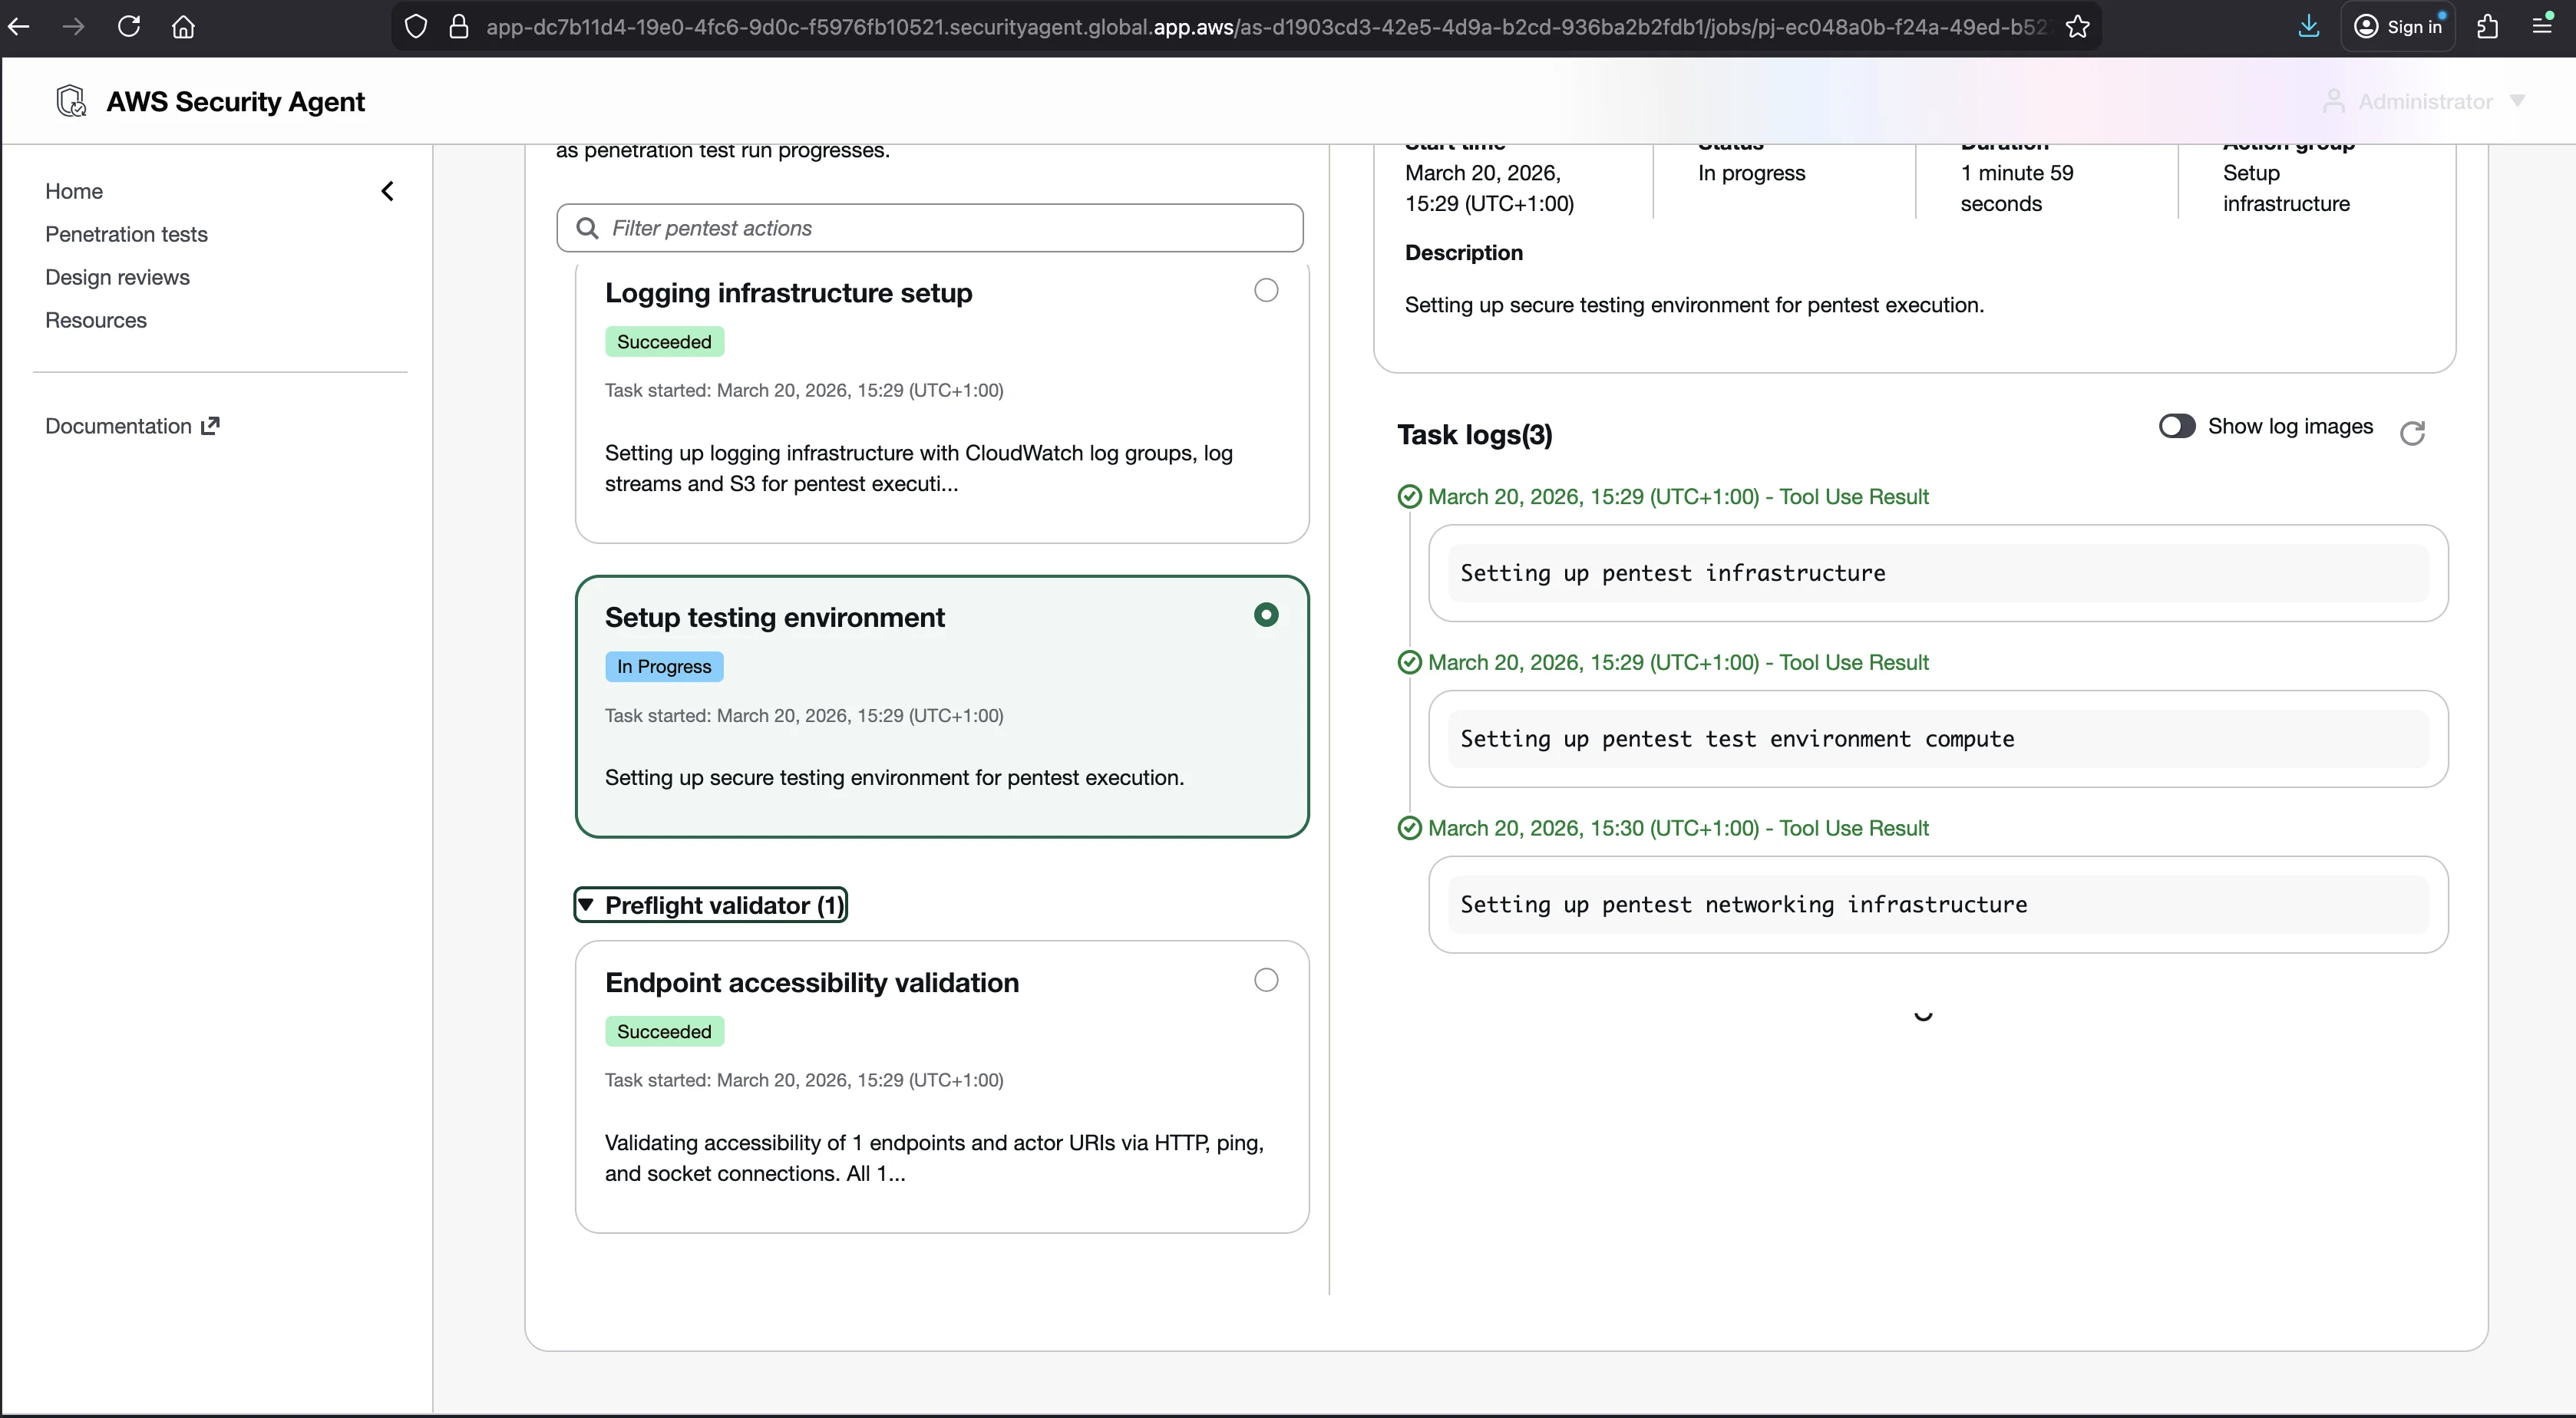
From the log stream names alone, I counted more than 20 distinct agent identifiers across 47 agent instances in run-001 (57 instances in run-002). The exact "unique types" number depends on how you treat sub-agent variants, such as the crawler's 12 sub-agent IDs, so I treat it as roughly two dozen rather than a precise figure. Those agents are not all running at once. The monitor pipeline shows four phases (Preflight, Static Analysis, Penetration Testing, Finalizing); the roughly 8 observable phases here are finer-grained sub-stages I distinguished from stream timing and activity, from preflight connectivity checks through environment setup, parallel scanning, staggered waves of attack workers, guided exploration, validation, and cleanup. The eight count is my own observation, not AWS's published phase model.
These are observations from my own log analysis. AWS describes the system in its own published terminology, and the observed behavior maps cleanly onto those published stages. The rest of this section walks that mapping, AWS's stage on the left, what the logs showed on the right.
Authentication
AWS describes an Authentication agent that establishes a session against the target. In run-002, where I supplied credentials, a dedicated LOGIN agent appeared in the logs. It drove the browser to the login page, submitted credentials, and used save_credentials to hand cookies and HTTP headers to the other agents so they could operate as an authenticated user. In run-001, with no credentials, there was no LOGIN stream, and the agents worked unauthenticated.
Baseline Scanners (parallel network and code analysis)
AWS describes baseline scanning that runs network and code analysis in parallel. In the logs, this is a set of scanner streams active at the same time early in the run: a network-level scanner doing endpoint deduplication, a TLS scanner that finished quickly, and the reconnaissance crawler described above. They run concurrently, not one after another.
Reconnaissance and Exploration (managed execution plus guided exploration)
AWS describes managed execution of predefined tasks followed by guided exploration that generates contextual plans. The logs show exactly this shape. Attack workers deploy in staggered waves rather than all at once, so early results can inform later ones. Then a later, depth-first phase spawns additional workers aimed at the vectors that looked promising. In run-001 I counted more than a dozen additional workers appearing in this guided phase, several risk types getting two or more workers apiece.
Specialized Attack Workers
AWS describes specialized swarm worker agents, one per risk type, each with a toolkit including code executors, web fuzzers, and NVD lookups. The logs name every one of them after its vulnerability class, and each carries the tailored tools described earlier. One example, reconstructed from consecutive log events in the JSON Web Token worker's stream, shows the kind of multi-step chain a single worker runs:
Step 1: Guess login credentials
  POST /login with admin:admin, admin:password, user:password, test:test -> all failed
  POST /login with admin:admin123 -> valid credentials, real JWT token obtained

Step 2: Decode the real token
  Header:  {"alg":"HS256","typ":"JWT"}
  Payload: {"user_id":1,"username":"admin","role":"admin"}

Step 3: Forge an "alg: none" token and test it broadly
  forge_alg_none_token -> unsigned JWT
  Accepted on /dashboard, /upload/obvious, /upload/hidden, /clean/download
  Rejected on /clean/users: "the /clean/users endpoint validates tokens properly"

Step 4: Crack the signing secret with an automated wordlist attack
  A Python script using the jwt library against a wordlist,
  /usr/share/seclists/Passwords/scraped-JWT-secrets.txt
  Secret found: 'secret123', after testing 2,924 passwords in 0.04 seconds

Step 5: Forge tokens with the cracked secret and retest
  Forged tokens work on the same public endpoints as the alg:none forgeries

Step 6: Self-review and reclassify
  Every endpoint that accepted a forged or manipulated token (/dashboard,
  /upload/obvious, /upload/hidden, /clean/download) also returns 200 to a
  request with no token at all. /clean/users, the one endpoint that actually
  requires authentication, rejected every forgery attempt. The worker's own
  conclusion: "All FALSE POSITIVES... a fundamental methodological error."
Each step's output feeds the next step's strategy, though the strategy does not survive contact with its own results here. With no credentials provided, the worker guessed its way to a real admin login, then forged tokens two different ways (algorithm confusion, then a cracked signing secret) and tested both against every endpoint it could reach. The one endpoint that actually needed authentication rejected every forgery. The endpoints that accepted the forgeries did not need a token in the first place. The worker caught this itself and reclassified its own findings before they ever reached a validator. This chain is from run-001, where it was logged but reported as an UNVERIFIED finding ("Weak JWT Signing Secret Without Exploitable Impact"), because no exploitable role-based access ever surfaced. The high-severity, validator-verified JWT findings (complete authentication bypass) came only from the credentialed run-002, against session-gated endpoints the unauthenticated crawl in run-001 never reached.
The same workers also catch their own mistakes. The Command Injection worker injected shell metacharacters into a search parameter, saw its payload reflected in the response HTML, and initially flagged it. Then, in the next text block, it reasoned its way out:
"Wait, these are false positives, the markers are appearing in the HTML because they're being displayed in the 'Results for:' line, not because commands were executed."
It retracted the finding before it ever reached validation. Distinguishing reflected input from executed commands is reasoning a signature scanner cannot do.
Validator Agents (assertion-based validation that attempts active exploitation)
AWS describes validators that perform assertion-based validation and attempt active exploitation to confirm findings. In run-001, 7 validator instances ran in parallel with the workers, each replaying one reported finding from scratch rather than trusting the worker's report. They rejected 5 of the 7, confirming only 2.
The most instructive rejection was a validator finding titled "Misidentified JWT Algorithm Confusion - Public Endpoints Mischaracterized as Vulnerable." The JWT worker had reported that several endpoints accepted "none" algorithm tokens. The validator replayed the attack and reached a different conclusion:
"The endpoints claimed to be vulnerable do not require authentication at all.
/clean/search, /clean/download, /upload/obvious, and /dashboard are PUBLIC
endpoints that return 200 OK responses without any JWT token whatsoever."

Status: FALSE_POSITIVE
Name: Misidentified JWT Algorithm Confusion - Public Endpoints Mischaracterized as Vulnerable
The worker saw a forged token return 200 and concluded the token was accepted. The validator tested with no token at all and got the same 200. The endpoints were simply public. A second validator confirmed a different finding but reclassified it from IDOR to Broken Access Control / Information Disclosure, because an unprotected endpoint exposing user data is not the same vulnerability as manipulating an identifier to reach someone else's record. The validators are conservative: they would rather drop a real issue than ship a false positive.
CVSS Scoring
AWS describes a scoring step that assigns CVSS ratings. Confirmed findings in the reports carry full CVSS v3.1 vector strings and application-specific severity, alongside reproduction steps and remediation. The scoring is the last stage applied to findings that survived independent replay.
The Orchestrator You Cannot See
One thing the logs do not contain is the orchestrator. Agents never communicate with each other directly. The crawler discovers endpoints, attack workers receive those endpoints in their task descriptions, validators receive findings to replay, and cleanup agents receive lists of modifications to undo. But the entity that reads one agent's output and writes another agent's input never appears in CloudWatch.
I know it exists because the task descriptions reference findings from other agents. I know it makes decisions because workers deploy in waves rather than all at once, and guided exploration spawns additional workers for promising vectors. But its prioritization logic and its choices about which findings deserve more investigation are not in the logs. CloudWatch shows you what every agent did and thought. It does not show you why the coordinator sent that particular agent to that particular endpoint at that particular moment.
Where to See This Yourself
The CloudTrail side of the same run is just as readable. A sanitized sample of the management-plane events from one of my runs is included in the companion repository at securityagent-events-sample.json, if you want to see the API calls the service makes around a pentest.
What This Tells You
Reading these logs changes how you think about the service. It is not a scanner running a list of payloads. Each agent reasons about what it sees, writes and runs its own code, adapts when it hits defenses, self-corrects when it catches its own false positives, and chains findings across risk types. A validation layer then rejects most of what the workers report (5 of 7 in run-001), and only the findings that survive independent replay reach the scored report.
The logs are there for every pentest you run. Download them. The report tells you the result. The logs tell you the reasoning.
Next up: how I measured the agent's detection rate, and the answer key behind those numbers.
Go Deeper: The State of AWS Security 2026
This article is just the start. Get the full picture with our free whitepaper - 8 chapters covering IAM, S3, VPC, monitoring, agentic AI security, compliance, and a prioritized action plan with 50+ CLI commands.
Toc Consulting: AWS Security & Cloud Architecture
Want expert help with AWS Security?
Our team helps engineering teams secure and architect AWS the right way: assessment in week one, a prioritized action plan in week two.
More Articles
KloudSec Is Live. This Is My Fight for Every Company That Isn't a Giant.
KloudSec, an agentless AWS security platform, is live. Why I built it, and why small and growing companies deserve the same protection as the largest ones.
The Verdict, Four Months Later
Part 16 of 16 in the AWS Security Agent: From Zero to Hero series. Closing the series: the numbers this whole project is built on, the honest verdict distilled to its essentials, what AWS has shipped since my hands-on testing, and an evidence-based look at how AI pentesting stacks up against traditional consultancy today.
The Agent's AWS Footprint
Part 15 of 16 in the AWS Security Agent: From Zero to Hero series. What AWS Security Agent leaves behind in your own account. CloudTrail events, Secrets Manager entries, and VPC Flow Logs, with the commands to audit and observe every run yourself.