
Chaos Engineering on AWS: CPU, Memory, and Network Faults with AWS FIS and SSM
Tarek Cheikh
Founder & AWS Cloud Architect
This is Article 5 in the "Chaos Engineering on AWS" series. We stop killing instances and start degrading the whole fleet: CPU saturation, memory pressure, injected network latency, and packet loss. One pair of faults turns a healthy service into seven-second page loads while every error dashboard stays green.
Gray Failures Are Worse Than Outages
Articles 1 through 4 dealt with binary failures: an instance is stopped, a database fails over, a backend disappears. Real systems usually die more quietly. CPU saturates. Memory fills. A network path starts dropping packets. The component is still there, still answering health checks, just slow. These gray failures are more dangerous than clean outages, because your error rate stays at zero and your dashboards stay green while customers abandon their carts.
In this article we inject four faults across both instances of our fleet at once and measure request latency. The application is the Chaos Shop from earlier articles: instances behind an ALB, backed by Aurora. Code at github.com/TocConsulting/chaos-on-aws, in 05-stress-and-network-faults/terraform/.
Hit the Whole Fleet, Not One Instance
The single most common mistake with FIS is targeting one instance out of many. If you stop or stress one of two instances, the load balancer simply routes around it and you see almost nothing. That is not resilience; it is a measurement artifact. To learn anything about how the service degrades, the fault has to hit enough of the fleet that there is nowhere to hide. We use selection_mode = "ALL" so every instance is degraded simultaneously.
An Important Detail: These Are SSM Documents, Not FIS Actions
AWS FIS does not have a first-class action called aws:ec2:cpu-stress or aws:ec2:network-latency. Instance-level resource stress and network faults are delivered through the generic action aws:ssm:send-command, pointed at an AWS-owned SSM document named AWSFIS-Run-*. Those documents run stress-ng (CPU, memory, IO) or tc and iptables (network) on the instance.
Two prerequisites follow from that:
- The target instance must run the SSM Agent (pre-installed on Amazon Linux 2023) and carry an instance profile with AmazonSSMManagedInstanceCore.
- The FIS experiment role needs
ssm:SendCommandon the instances and theAWSFIS-Run-*documents, plus permission to list and cancel commands.
Here is the CPU stress experiment. The action is aws:ssm:send-command; the actual fault is named in documentArn; and the target selects every instance:
resource "aws_fis_experiment_template" "cpu_stress" {
  description = "Saturate CPU on the whole fleet for 120s"
  role_arn    = aws_iam_role.fis.arn

  action {
    name      = "cpu-stress"
    action_id = "aws:ssm:send-command"
    parameter {
      key   = "documentArn"
      value = "arn:aws:ssm:${var.region}::document/AWSFIS-Run-CPU-Stress"
    }
    parameter {
      key   = "documentParameters"
      value = jsonencode({ DurationSeconds = "120", LoadPercent = "100", InstallDependencies = "True" })
    }
    parameter {
      key   = "duration"
      value = "PT3M"
    }
    target {
      key   = "Instances"
      value = "chaos-lab-instances"
    }
  }

  target {
    name           = "chaos-lab-instances"
    resource_type  = "aws:ec2:instance"
    selection_mode = "ALL"
    resource_tag {
      key   = "Project"
      value = "chaos-lab"
    }
    filter {
      path   = "State.Name"
      values = ["running"]
    }
  }

  stop_condition {
    source = "aws:cloudwatch:alarm"
    value  = aws_cloudwatch_metric_alarm.unhealthy_hosts.arn
  }
}
The other three are identical except for the document and parameters: AWSFIS-Run-Memory-Stress (Percent = "80"), AWSFIS-Run-Network-Latency (DelayMilliseconds = "200"), and AWSFIS-Run-Network-Packet-Loss (LossPercent = "15").
One Gotcha That Cost Us a Run: the Network Interface Name
The network documents take an Interface parameter that defaults to eth0. On Amazon Linux 2023 running on Nitro, the primary interface is ens5. Our first attempt at the network experiments failed with an SSM error because tc was pointed at an interface that does not exist. Set Interface = "ens5":
value = jsonencode({ DelayMilliseconds = "200", Interface = "ens5", DurationSeconds = "120", InstallDependencies = "True" })An experiment that silently fails to inject is worse than no experiment, because it gives you false confidence. Always confirm the fault landed and that you can see its effect.
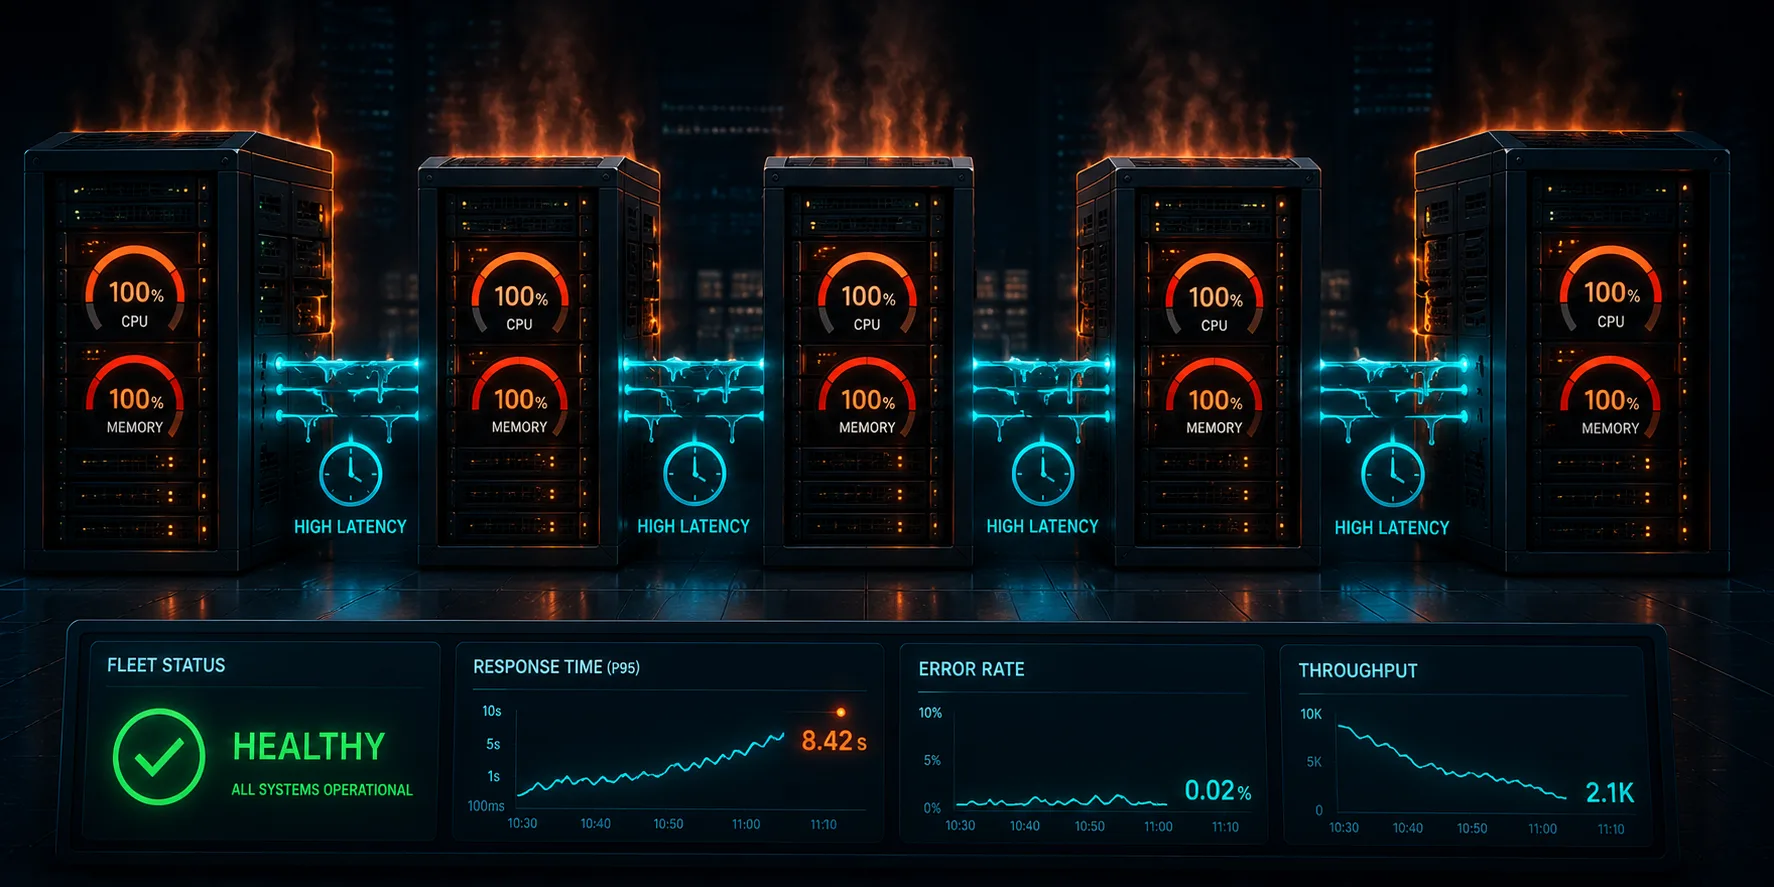
The Results
The traffic generator hits /products (which reads all ten products from Aurora on every call) twice a second and records latency. We capture a baseline, then start the fault across the whole fleet and capture latency during it. Real numbers from a live run:
| Fault (entire fleet) | Baseline p95 | During p95 | During p99 | During max |
|---|---|---|---|---|
| CPU stress 100% | 305 ms | 208 ms | 217 ms | 237 ms |
| Memory stress 80% | 202 ms | 205 ms | 235 ms | 260 ms |
| Network latency +200 ms | 224 ms | 2825 ms | 3545 ms | 3828 ms |
| Packet loss 15% | 238 ms | 2275 ms | 4847 ms | 6997 ms |
The network faults killed the service
Two hundred milliseconds of injected latency on every instance pushed p95 from 224 ms to 2825 ms, and the worst responses approached four seconds. Fifteen percent packet loss was even more violent: p99 of 4847 ms and a worst case of seven seconds, because dropped packets trigger TCP retransmission timeouts measured in whole seconds. Every product page now took between two and seven seconds to load. No human waits seven seconds for a product list, and no checkout survives it. By any service-level objective, the service was down.
Here is the dangerous part: throughout both network experiments, the HTTP status was 200 OK and the error rate was zero. If your alerting watches 5xx rates, it never fired. If your dashboard shows availability as "percentage of non-error responses," it showed 100 percent. The service was effectively dead and every error-based signal said it was perfectly healthy. That is a gray failure, and it is exactly why chaos engineering measures latency percentiles, not just error counts.
CPU and memory stress did nothing, and that is the lesson
Saturating the CPU at 100 percent and memory at 80 percent on every instance changed the latency distribution almost not at all. The fault landed (stress-ng was pegging both instances), but the application did not care, because /products is database-bound. The Flask process spends its time waiting on the Aurora round trip, not burning CPU. Stressing a resource the workload is not bottlenecked on shows you nothing.
This is not a reason to skip CPU and memory faults. It is the reason to run all of them: you cannot guess which fault matters; you have to inject each one and measure. For this database-bound read path the bottleneck is the network and the database round trip, so network faults are catastrophic and compute faults are invisible. For a CPU-bound service (image processing, encryption, heavy serialization) the table would be inverted. The only way to know your bottleneck is to attack each resource and watch what moves.
Why the p95 and p99 Matter, Not the Average
During the network latency fault, the median (p50) was 203 ms, barely above baseline. If you watched only the average or the median, you would have concluded the fault was mild. The catastrophe was entirely in the tail, where p95 was 2.8 seconds and p99 was 3.5. Averages hide the experience of your unluckiest users, and during a gray failure your unluckiest users are most of your traffic. Every dashboard in this series tracks p99 for exactly this reason.
Deploy and Run
cd chaos-on-aws/05-stress-and-network-faults/terraform
terraform init
terraform apply

aws fis start-experiment --experiment-template-id $(terraform output -raw fis_packet_loss_id)
Watch p99 latency on the CloudWatch dashboard while the experiment runs. Give the SSM document a few seconds to install stress-ng or configure tc on the first run.
What Is Next
We degraded an entire fleet and learned that the fault which matters is the one that hits your real bottleneck, and that a service can be completely dead while every error metric reads green. But the fleet still lived in one Availability Zone. In Article 6, we raise the blast radius to a whole AZ using the AWS FIS AZ power-interruption scenario and Application Recovery Controller, and test whether a multi-AZ architecture is as resilient as the diagram claims.
Cleanup
terraform destroyTear the lab down when you are done so it does not run up a bill.
References
Go Deeper: The State of AWS Security 2026
This article is just the start. Get the full picture with our free whitepaper - 8 chapters covering IAM, S3, VPC, monitoring, agentic AI security, compliance, and a prioritized action plan with 50+ CLI commands.
Toc Consulting: AWS Security & Cloud Architecture
Want expert help with Chaos Engineering?
Our team helps engineering teams secure and architect AWS the right way: assessment in week one, a prioritized action plan in week two.
More Articles
Chaos Engineering on AWS: Running a Program with GameDays and Continuous Chaos
One experiment is a demo. A program is what builds resilience. Turn FIS experiments into an ongoing practice: the resilience flywheel, GameDays, continuous automated chaos on a schedule and in CI/CD, and AWS Resilience Hub. Includes a real, validated EventBridge Scheduler setup and the jsonencode gotcha that makes a recurring schedule silently run only once.
Chaos Engineering on AWS: Multi-Region Disaster Recovery and Measuring Real RPO
Stop talking about disaster recovery and measure it. Pause DynamoDB global table replication with AWS FIS while a live two-Region application keeps writing, then count exactly how many records the surviving Region cannot see. Real Terraform, real RPO, real recovery time.
Chaos Engineering on AWS: Containers and Serverless with FIS (ECS Fargate and Lambda)
Leave EC2 behind. Stop a whole Fargate task set and force AWS Lambda invocations to error and to stall, using AWS FIS. Real Terraform, real numbers, and the exact setup gotchas for the Lambda fault-injection extension.